No. 50, August 2011
| |
|
|
No. 50, August 2011 |
|
|
No. 50 Their 'Growth', Their Slowdown, and the Condition of the People |
Their Growth, Their Slowdown and the Condition of the People The current industrial slowdown has been the main topic of discussion in the financial papers in recent months. Over the past year, the rate of growth of the Index of Industrial Production has been slowing continuously; the figure for May 2011 is 3.6 per cent, compared to 12.2 per cent in May 2010.1 The extent, causes and remedies of the slowdown are being debated by industrialists, government bodies, and international institutions. The share markets, which the media project as the principal indicator of the country’s economic health, have been jittery with the reports of slowing corporate profits. The debate is posed as one between inflation and ‘growth’: Is the Reserve Bank correct in hiking interest rates – specifically, the rate at which it lends to banks – in order to rein in inflation, despite the fact that these interest rate hikes are leading to lower growth? The RBI has now hiked this rate 11 times in the last 16 months, from 4.75 per cent to 8 per cent. Representatives of big industry criticise these hikes, and warn that they will strangle growth; representatives of big finance, particularly foreign institutional investors (FIIs), talk of the need to raise interest rates to tackle inflation. Within this frame, of course, this debate is of little interest. As we shall see, the ‘growth’ around which the discussion is focussed is irrelevant to the people. We shall also see how those demanding interest rate hikes are actually unconcerned about inflation as it affects the vast majority of the people. Indeed the entire discussion of the slowdown brings to the fore once again the gulf between the economy of the elite and that of the masses of people. This should not be taken to mean that the two operate independently of each other; rather, the former is rising on the bony and weary back of the latter. As the elite strains to reach higher and higher, it plunges the people into the depths.
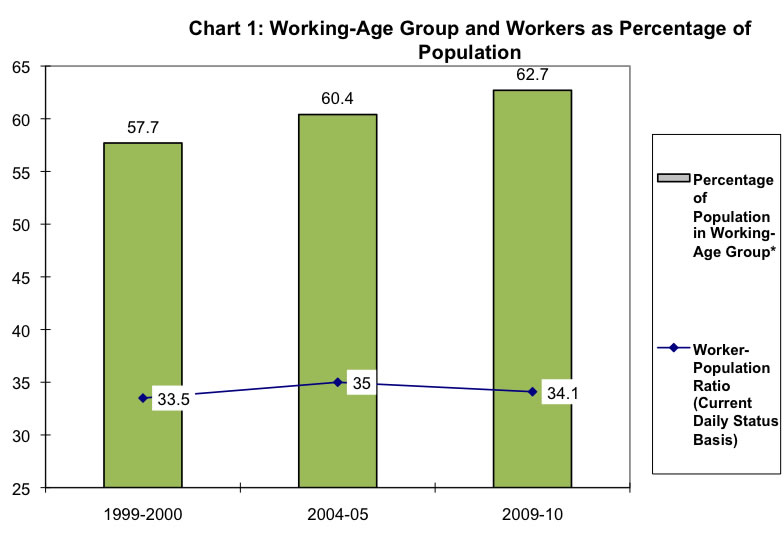
I. ‘Growth’ Fetishism We are indoctrinated by the Government and the media to unquestioningly value ‘growth’ above all else. What exactly do they mean by ‘growth’? Generally the measures referred to in this context are the gross domestic product (GDP) and, in the present debate, the Index of Industrial Production (IIP). Let us take the former. GDP is the sum of all the value added in the economy (i.e., the market value of all goods and services in the economy minus the market value of the material inputs that went into producing them) over a particular span of time, usually a year. The GDP measure does not tell us whether the goods or services created are socially useful and generate well-being; it does not take account of the harm, such as environmental damage, done to third parties in the course of production of these goods and services; it does not tell us about the sustainability of the growth – for example, whether limited mineral resources are being rapidly exhausted; it tells us nothing about the distribution of the income so generated. So when new highways or automobile plants displace subsistence producers, when airports or real estate projects displace slumdwellers and throw them into distant camps, or when forests are submerged so that power plants can feed airconditioners, the GDP rises, and that fact is treated as sufficient justification for the activity. GDP no longer is treated as a concept, a measure: It is treated as a real thing; in a perverse reversal, the real world of social relations is shaped in order to promote GDP. It is as if a mute idol shaped by human beings were to acquire mysterious powers over them, demanding bloodier and bloodier sacrifices. Nor is there any limit to the amount the GDP should rise. Rather, it must rise every year; it must rise in per capita terms (i.e., it must rise faster than the population); and in fact its rate of growth must keep rising, or at least not fall. Thus where once 6 per cent was considered a creditable rate of growth for India, the bar was later raised to 8 per cent, and now, having crossed 9 per cent in some years, a return to 8 per cent is viewed as ground for deep concern, warranting ‘remedial measures’ – inevitably, the creation of further opportunities for private corporate profit and public harm, such as the further relaxation of environmental regulation and labour laws, or the further opening of the retail sector, insurance, and other restricted sectors to foreign investment. Deliberately left out of the discussion are such elementary questions as the following: Does the economic activity under discussion meet people’s minimum material and cultural needs? Does it provide adequate and decent employment? Does it avoid harm to people’s environment and future well-being? (There are further questions to be asked, but the discussion does not even get this far.) Let us take a few examples in relation to the above questions: (i) Material needs: The per capita production and consumption of food has been declining over the medium term, and malnutrition in a large section of the population is at levels comparable to sub-Saharan Africa.2 Nearly half of all children under five suffer from moderate to severe malnutrition; a third of adults suffer from chronic energy deficiency. A new measure of ‘multidimensional poverty’ (which takes into account deprivations of nutrition, child mortality, schooling, enrolment, electricity, sanitation, drinking water, flooring, cooking fuel, and assets) finds that there are more multidimensionally poor people in just eight states of India than in all of sub-Saharan Africa.3 (ii) Employment: Organised sector employment actually shrank during the period of frenetic growth; the figure for 2008 was lower than that for 2000.4 As for overall employment, the latest National Sample Survey data, for the year 2009-10, show that employment growth has virtually stalled, growing at an annual rate of less than 0.1 per cent since 2004-05. While the percentage of the population deemed of working age (between 15 and 59) has risen by 5 percentage points over the last decade, a falling share of this working-age population obtains employment. (See Chart 1.) In the last decade, roughly 159 million would have been added to the working age population, but only 65 million got employment of any type whatsoever.5 And the pattern of employment presents a picture typical of a very underdeveloped economy: More than half was ‘self-employment’, another third was casual labour, and only 16.6 per cent was ‘regular wage/salaried’ employment.6 Organised sector employment is even smaller – about 7 per cent. Such is the scene after two decades of ‘economic reforms’, which were trumpeted as modernising India and turning it into a ‘tiger’ economy. According to a currently fashionable theory (which has its roots in the discredited theory of the 18th century political economist Thomas Malthus), India will enjoy a ‘demographic dividend’ in the coming years as those of working age increase as a share of the total population for the next 20-30 years or so. Kaushik Basu, the chief economic adviser to the Prime Minister, lists the alleged benefits:
All this speculation, however, hinges on sufficient employment actually being generated to employ those potential “bread-winners”, failing which they remain merely bread-eaters, or more likely, those left hungering for bread. As can be seen from the actual employment trends, it is the grimmer scenario that is materialising. (iii) Environment and natural resources: Jairam Ramesh, when he was Union minister for environment, admitted that “We are presently following development plans blindly which can only lead to damage of the environment with ultimate impact on the people."8 Yet he continued to churn out environmental clearances at the same breakneck speed as his predecessors, with a rejection rate of just 1 per cent.9 He candidly confessed: “I am guilty in some cases of having actually condoned many environmental violations.”10 One can temporarily increase one’s income by depleting one’s assets. It would hardly be meaningful to say that a peasant who sells off his land becomes richer in the year he receives the sales proceeds. Thus, if we take into account the depletion of natural wealth, it may emerge that the long-term productive capacity of the economy is not growing, but declining. According to a calculation made by the economist Partha Dasgupta, the ‘comprehensive wealth’ of India (which includes all its capital assets, physical and intangible, man-made and natural) declined in per capita terms over the period 1970-2000 at the rate of 0.4 per cent per year.11 The same methodology extended to the last decade may or may not show a continuing absolute decline in per capita wealth, but it would certainly provide a much grimmer picture than the rosy one depicted by GDP data. As such, then, ‘growth’ of the GDP or IIP is at present delivering neither jobs nor basic needs for the majority of people, even as it exhausts natural resources and delivers environmental destruction. So a slowdown in the growth rate, while a matter of great concern for the rulers, is not in itself the headache of the people. If, nevertheless, we examine the current slowdown, it is to understand the processes of the economy and their implications for the people.
II. Growth on Steroids When one keeps in mind the appalling material condition of the vast majority of people in the country, it is not the slowdown that requires explanation, but the phases of growth. Given that there is not a rapidly growing market for items of mass consumption, what has been powering the growth?
It is evident that, prior to 2003-04, the results of the ‘reform’ would hardly inspire confidence even among its proponents. Although the rate of investment rose somewhat, the increased investment did not result in faster growth of physical output. There was only a marginal increase in the average growth rate of GDP; this came entirely from the growth of the services sector, with average industrial and agricultural growth considerably lower than in the earlier period. This does not bear out the theory of ‘unshackling’ as the explanation for the increased growth rates in recent years. It appears that India’s rapid growth in recent years has drawn on special factors that have provided periodic boosts: A large influx of foreign capital, leading to lower interest rates and increased lending by banks to the urban middle and upper classes to buy homes, cars, and electronic items; Government policy changes creating new avenues for private enrichment; and a range of open and hidden Government subsidies to the corporate sector. All of these have played important roles in triggering a private corporate investment boom. Spells of increased Government spending which put sizeable lump sums in the hands of the middle class, such as the implementation of Pay Commission recommendations (increased salaries and payment of arrears), also provided a temporary boost to demand from time to time. However, the narrowness of the sources of demand, and the consequent pattern of growth, have also restricted the employment generated by this corporate boom, and thus the benefits of this growth have been restricted to a small section of society. Once taken off steroids, as it were, this growth tends to slow down. True, an increase in Government spending can counter such a slowdown, but the financial interests dominant today permit a significant rise in such spending only in order to tide over an acute financial crisis. Once that immediate crisis is over, they insist that overall Government spending be reined in once more. As world economic growth declines again, so too may foreign capital flows to India. That, combined with the self-imposed restraint on Government spending, means that the economy is in for another spell of slower growth. There is another path to industrial growth (albeit slower and low-profit), one which would not depend on such steroids: Namely, growth based on widely-dispersed domestic demand for simple items of mass consumption, such as textiles, footwear, pens, umbrellas, soap, utensils, and hundreds other such – items on which the common people stint, for lack of purchasing power. The technology for such commodities can be quite ‘low’ and labour-intensive, and thus this sector can generate vast employment if the masses have sufficient purchasing power and the choice of technology is socially controlled. However, a precondition to such growth is to generate enough purchasing power among the masses for such commodities, and to create institutions that would socially regulate the pattern of development. For this it is critical to carry out sweeping changes in the production relations and social institutions in the rural areas, a task that is clearly beyond the present social order.
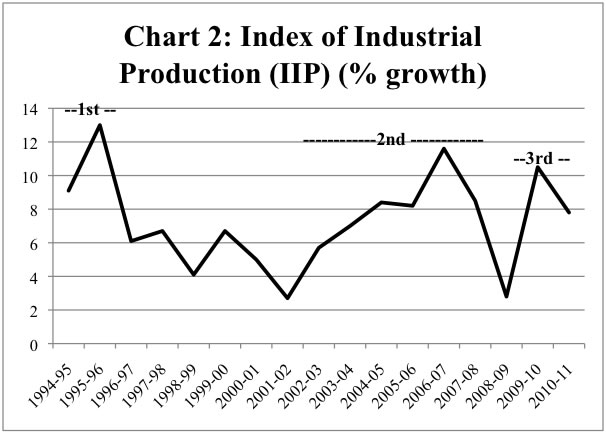
There have been three bouts of rapid growth in the index of industrial production (IIP) since the start of economic ‘liberalisation’ in 1991 (see Chart 2). The first came shortly after the scrapping of industrial licensing, and lasted just two years, 1994-95 and 1995-96, when the IIP growth rate soared to 9.1 and 13.1 per cent respectively. In this brief boom it was all sorts of newly liberalised luxury items that led the breakneck growth.13 Consumer durables grew at 16.2 and 25.8 per cent respectively; they collapsed equally dramatically in 1996-97, to 4.6 per cent. Then followed seven years of moderate to slow growth before the next upward turn (barring a one-year spurt of growth at the end of the 1990s thanks to the Fifth Pay Commission payments to Government employees). In this seven-year lull, the Government focussed on liberalising, deregulating, and providing concessions to the private sector, domestic and foreign, but did not resort to increased spending. Rather, it placed a straitjacket on its own spending with the Fiscal Responsibility and Budget Management Act. It was not rewarded with another boom, despite the emergence of one important new sector that grew very rapidly, namely, the information technology (IT) sector. The growth of this sector had less to do with the domestic economy than with external developments: the development of information and communications technology, and the growth of outsourcing by the US and other developed economies.
When the US economy slipped into recession in 2000-01, the US government lowered interest rates and expanded debt in order to revive growth. This unleashed a flood of capital from the US which surged across the world. Borrowing at rock-bottom interest rates in the US, speculative finance invaded ‘emerging markets’ like India from 2003-04 on in search of higher returns. Net capital inflows as a percentage of India’s GDP soared from 2 per cent in 1998-2003 to 4.8 per cent in 2003-2008, peaking at 9.2 per cent in 2007-08.14 The increased liquidity in the banking sector in India fueled the rapid growth of lending for homes, cars and other such items. Outstanding personal loans made by commercial banks rose from a few percentage points of GDP at the start of the decade to 7.6 per cent at end-March 2005 and 10.3 per cent at end-March 2008.15 In response, IIP growth in India rose steeply, from 7 per cent in 2003-04 to 11.5 per cent in 2006-07. However, thereafter it began to slow once again. The starting point of the decline is in some dispute, but it clearly began well before the onset of the global crisis in October 2008. It can be traced largely to certain factors, such as the rise in the rupee’s exchange rate, and the constraints of the market, which were not incidental, but were built into the boom itself.16 In 2008-09, the full effects of the global crisis, which was triggered by the collapse of the US investment bank Lehman Brothers in October 2008, were felt; IIP growth slumped sharply. As the RBI Report on Currency and Finance 2008-09 pointed out, the thesis of ‘decoupling’ (i.e., the thesis that India’s growth is de-linked from that of the advanced economies, and will not be affected by a slump in the latter) took a beating with the crisis. Rather, the RBI noted, the correlation between India’s growth and that of the advanced countries had increased sharply in recent years. Moreover, “while traditionally the trade channel was the primary conduit of transmission of [external] shocks to the real sector, financial channels have emerged stronger over time,” (p. 289; emphasis added) that is, the global crisis hit India not only through a fall in export demand, but even more through the drying up of capital flows. Corporate rescue package The Government initiated a rescue package aimed at the corporate sector. It compelled public sector banks to extend fresh loans to large indebted firms (thus saving several real estate and airline firms from bankruptcy). The number of cases under ‘corporate debt restructuring’ saw a steep rise.17 The Centre rolled out generous tax reliefs to the corporate sector: Its indirect taxes (customs, excise) plus corporation income tax fell from 9.5 per cent of GDP in 2007-08 to 7.5 per cent of GDP by 2009-10. The Centre hiked its own ‘infrastructural’ spending in order to boost demand for the corporate sector, and rushed clearances for private sector infrastructural projects. Bank credit to infrastructure leapt by 44 per cent, or almost Rs 1,22,000 crore (Rs 1.22 trillion), between May 2009 and May 2010. The Sixth Pay Commission hike in Government employees’ salaries (plus payment of arrears) further fueled consumer demand. Central government expenditure rose as a percentage of GDP by three percentage points (see Chart 3). The GDP of Government services rose at twice its earlier rate, and faster than any other sector of the economy in 2008-09 and 2009-10.18 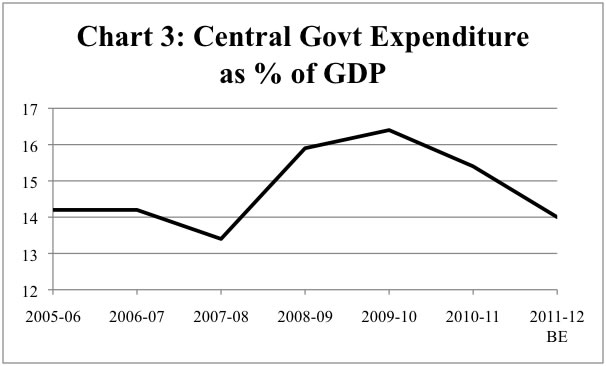 Note: BE= Budget Estimate. Source: Union Budget documents. Meanwhile, in response to its crisis, the US massively greatly expanded its fiscal deficit, reduced central bank interest rates to near-zero levels, and pumped in additional money by means of central bank purchases of bonds. A fresh wave of funds flowed from the US to the rest of the world. Net foreign capital inflows, which had declined to $8.7 billion (0.7 per cent of GDP) in 2008-09, revived to $53.4 billion (3.9 per cent of GDP) in 2009-10. After a short lag, the IIP turned around at the start of 2009-10, and rose over the course of the year (see Chart 5). The growth rate of non-government non-financial corporate profits, which had fallen sharply in 2008-09, rose sharply again.19 This was the third bout of IIP growth. 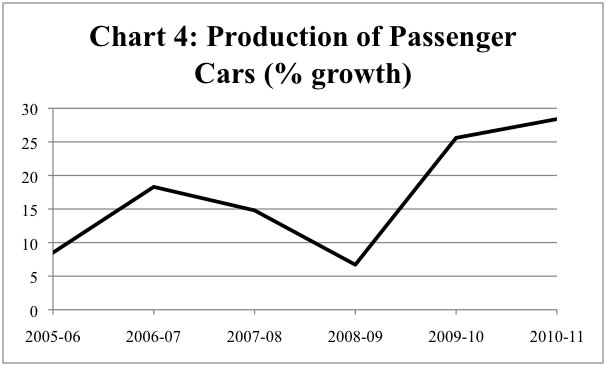 Source: Index of Industrial Production. Industry was jubilant at the recovery, but at the same time betrayed an underlying anxiety. In January 2010, well after industry had bounced back from the slump of 2008-09, two dozen top industrialists met the finance minister and called for the ‘stimulus’ package to be extended. “I have great self-interest” in the Government continuing with the stimulus package and fiscal incentives, said Ratan Tata; the buoyancy in the automobile market, he pointed out, reflected the benefits of the package.20 (See Chart 4.) He spoke not only as the chairman of Tata Motors, but also as the chairman of Tata Steel, which depends heavily on sales to the automobiles, consumer durables, construction and infrastructure sectors, all of which benefited from the ‘stimulus package’. Tata Steel’s steel sales in India rose by 18 per cent in 2009-10, from 5.2 million tonnes to 6.2 million tonnes, and further to 6.4 million tonnes in 2010-11. The firm has a 42 per cent market share of steel for the automotive sector in India, to which it sold 1 million tonnes of the 3.5 million tonnes of flat products it sold in 2010-11.21 Similarly, the partial revival of the real estate sector renewed demand for the manufacturers of steel, cement, glass, electrical goods, lifts, and other such products. By the second half of 2009-10, as big industry turned optimistic and laid out fresh investments, the capital goods sector (means of production – plant, machinery, commercial vehicles, etc.) grew rapidly . However, the revival bypassed certain other items, in particular, mass consumption goods. This points to the fact that, while the Government’s sudden burst of spending and deficits appeared superficially to be ‘Keynesian’ stimulation of demand, it ignored Keynes’ advocacy of reviving demand by putting income in the hands of low-income sections through large-scale creation of public works employment.22 Instead the Government focussed on bailing out and fattening the corporate sector (and for this also stimulating demand among upper-income sections). This class policy had its effect on the pattern of the recovery, to which we will return later. The slowdown Central government expenditure is budgeted to fall sharply this year to just 14 per cent of GDP. The RBI has hiked interest rate three times since the start of the financial year 2011-12. Finally, the world economy is heading for a slump, and foreign capital flows to India are slowing down. In these circumstances, IIP growth is set to slow down. The third bout of rapid growth in IIP in the post-1991 period appears to be petering out. 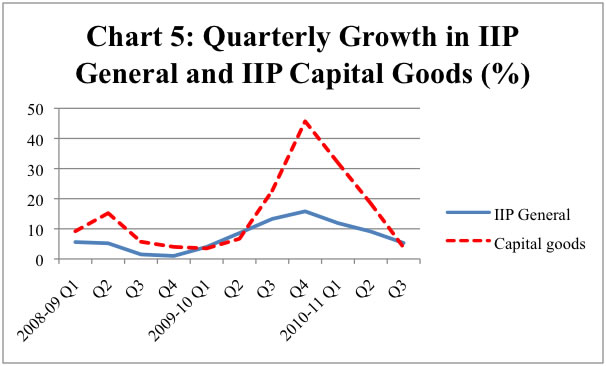 Source: Economic Survey, 2010-11; IIP 1993-94 series.
IV. The Divergent Fates of Luxuries and Mass Consumption Goods Interestingly, in this brief recovery of 2009-11, consumer durables – a category that includes passenger cars, air conditioners, refrigerators, motorcycles, and other luxury items – saw a dramatic revival. From an absolute fall in production in 2007-0824, it turned around to achieve 24.6 per cent growth in 2009-10 (see Chart 6). As with earlier bouts of consumer durables growth, however, this one too has begun to falter. Apart from the fact that the effect of the Pay Commission payments must have dissipated, and the increases in interest rates must have started to deter borrowers, there is a further factor behind this slowing in consumer durables: there is only a limited market in India for such commodities. Most people buy durables rarely if ever, and there is only a narrow class of people who buy durables regularly. By contrast with durables, it should be noted, there was never any recovery in consumer non-durables, a category composed largely of items of mass consumption such as matches, soap, edible oil, tea powder, biscuits, cloth, footwear, pencils, and the like. Non-durables growth continued to fall even as consumer durables and the general IIP revived. It touched a low of 0.4 per cent in 2009-10, and remained at an abysmal 2.2 per cent in 2010-11. In other words, in per capita terms, production fell over these two years. Consumer durables make up only 5.3 per cent of the IIP. Nevertheless, they contributed 21 of total IIP growth in the last two years.25 By contrast, consumer non-durables, which make up almost a quarter of the IIP, contributed only about 3 per cent of IIP growth in this period.26 (Indeed, the state of the non-durables industry was perhaps even worse than is reflected in the IIP, which does not capture the data from unorganised industry, the main producer of consumer non-durables.) In other words, a very narrow segment of industry accounted for the overwhelming bulk of growth in consumer goods, and buoyed the overall IIP. 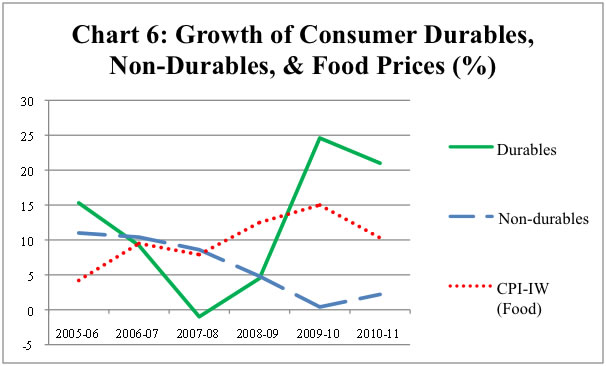 Note: CPI-IW (Food) is the Food index in the Consumer Price Index for Industrial Workers. Source: Index of Industrial Production 1993-94 series, and CPI-IW.
Chart 6 is very revealing: the graph of the food items in the consumer price index for industrial workers is the mirror-image of non-durables production – when food prices go up, non-durables consumption goes down. In other words, the poor performance of the non-durables sector reflects the poor condition of the bulk of consumers. The class nature of the ‘recovery’ of 2009-10 is starkly illustrated by the divergent graphs of durables and non-durables. In fact, the truth is even starker than can be seen in these figures. Not all non-durables are for the masses; within each category there are ‘upmarket’ and ‘downmarket’ brands – the Dove soaps vs. the Lifebuoys (or the cheap local soaps turned out by small manufacturers). Further, consumer goods industries today are churning out a plethora of new luxury commodities – cosmetics, hair dyes, instant foods, health drinks and foods, ice creams, confectionery, “Indian-made foreign liquor”, and so on. It appears such commodities are growing rapidly within the non-durables category; minus them, the performance of non-durables would be even worse. We can get an inkling of this in the latest results of Hindustan Unilever Ltd (HUL), a ‘fast-moving consumer goods’ giant. The largest segment of HUL’s revenues has traditionally been soaps and detergents, a mass consumption category (although it also contains several upmarket products). In 2010-11, sales of this segment rose by only 6.4 per cent, or less than the inflation rate (see Table 3). By contrast, the ‘personal products’ segment – defined as “oral care, skin care (excluding soaps), hair care, deodorants, talcum powder, colour cosmetics”, that is, catering to higher-income consumers – grew by 15.8 per cent and further increased its share of HUL sales. (Over the course of the decade, its share has risen by more than ten percentage points.) Even more striking are HUL’s profit trends. The profits of the soaps and detergents segment fell in 2010-11 by almost 30 per cent over the previous year, while those of the personal products segment rose by 15.3 per cent. Today the profits of the soaps and detergents segment account for a little over a third of the firm’s operating profit, whereas those of personal products – less than a third of sales – account for more than 60 per cent of operating profit. In other words, sales and profits grew rapidly in the segment catering to the better-off, whereas, in the mainly mass-consumption segment, sales fell in real terms and profits fell even in absolute terms. For fear of losing customers, the firm was unable to protect its profit margins in the soaps and detergents segment by increasing prices in line with rising material costs. The HUL executive director for ‘home and personal care’ explained in an interview:
The “schizophrenia” he refers to in the market is more properly termed its dualism, the gulf between the top crust of Indian society and the vast majority at the bottom.
Interestingly, a Crisil study notes that the price of many durables actually went down even as food prices rose: “food items saw a much sharper price increase as compared to non-food items. Food inflation was at 11.6 per cent during 2008-09 to 2010-11 as compared to non-food inflation of 5.7 per cent. Within the non-food category, prices of many items declined. For instance, in 2010-11, out of a total Wholesale Price Index (WPI) basket of 676 items, prices of 146 items in the WPI fell during the year. Prices of another 214 commodities witnessed only a moderate price rise of less than 4 per cent. The fall in prices was more evident in the durables category (television sets, washing machines, air conditioners etc.)”28 In other words, the rich got even richer in real terms, i.e., in terms of the goods they purchase.29 It is revealing that the abysmally slow growth in non-durables for the last three years caused no great alarm in the Government. The business press did not ponder the sharply deviating performance of the luxury industries and those producing items of daily use by ordinary people. Rather, its focus was on the the production of passenger vehicles and other such luxuries that rose spectacularly.
The situation has deteriorated particularly sharply over the last year (May 2010-May 2011). On the one hand bank credit to large industry rose by 27.8 per cent over the course of the year, on top of a steep 31.1 per cent growth the previous year.32 By contrast, the growth of credit to agriculture slowed sharply to 12.8 per cent (from 21 per cent the previous year). The growth of credit to micro and small industry slowed to 13 per cent (from 14.8 per cent the previous year). Given that the average inflation in the Consumer Price Index for Agricultural Labourers (CPI-AL) was 10.1 per cent in 2010-11, and that for Industrial Workers (CPI-IW) was 10.5 per cent, the growth of credit to agriculture and small industry was negligible in real terms. Thus the RBI’s fiddling with interest rates has limited relevance for micro and small enterprises. They are denied bank credit, and are forced to turn to usurious sources at high interest rates. The National Commission for Enterprises in the Unorganised Sector warned in 2008, at the onset of the global crisis, that small units were in danger of being squeezed even further out of bank credit:
The entire gamut of policies has worked against micro and small enterprises and in favour of large enterprises. So it is hardly surprising that household sector investment (largely investment in agriculture and micro/small units) fell as a share of GDP, even as investment by the private corporate sector rose (see Chart 7). 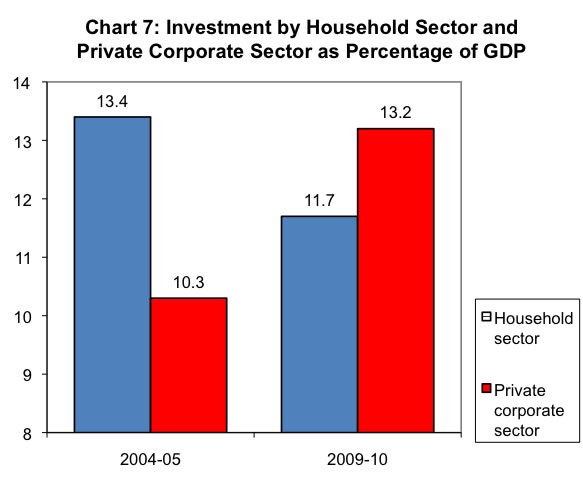 Source: Economic Survey 2010-11, p. 8. Starved of investment, the share of the unorganised sector in income generated in manufacturing declined from 37.2 per cent to 32.6 per cent between 1999-2000 and 2009-10 (see Table 4).
The implications of this for employment and the distribution of income can be understood when we keep in mind that the unorganised sector accounted for 88.5 per cent of the workforce in manufacturing in 2004-05 (see Table 5).
Organised sector manufacturing employment fell from the mid-1990s to the mid-2000s, then grew for the next five years, so that the net growth is abysmally low: As can be seen from Table 6, the growth in the entire 13-year period 1995-96 to 2008-09 amounted to just 0.88 million, a compound annual growth rate of 0.84 per cent.
In brief, when the ‘captains of industry’ oppose the interest rate hike in the name of industrial growth, they are merely pleading for the profits of the top crust of industry, one which employs few workers and is increasingly oriented towards producing for the top crust of society. The section of industry that employs the great majority of the workforce desperately needs bank credit at low interest rates, but is starved of it, with grave consequences for employment and industrial productivity. The disconnect between the growth of income and employment in large industry and small industry is one instance of a pervasive dualism in the Indian economy. We find a similar disconnect within the services sector: At the top is the rapidly-growing corporate segment of the services sector – finance, software, telecom, civil aviation, and so on, which make up a meagre share of employment but the bulk of the income; whereas in the rest of the services sector, such as petty retail, income is meagre but the employment is concentrated. Apart from the disconnect within each sector, there is an increasing disconnect between different sectors – agriculture, industry, and services. Where once growth in, say, agriculture would be accompanied by growth in industry or services, or vice-versa, that is no longer the case. An RBI study notes that “Empirical estimates indicate that there is a weakening of inter-sectoral linkages in the post-reform period in India. Major dilution in the strength of the relationship has occurred in the case of linkages between: (a) industry and services sector and (b) industry and agriculture sector....” At the same time as the internal linkages of the economy have weakened, its external linkages have strengthened. The RBI study notes: “services sector linkages have increased relatively more with the rest of the world than the domestic economy...”34 In another study, the RBI finds that Indian industry too has become more closely ‘coupled’ with the international economy.35 The increasing external integration of the Indian economy has accelerated its internal disarticulation, the disconnect between its parts. While those opposing the interest rate hikes are thus merely pressing their private interests, equally dubious are the claims of those who call for interest rate hikes in order to curb inflation. They firmly ignore cost-push causes of price rise (when the price of an important good such as foodgrains or oil rises sharply, and causes the prices of other goods to rise), and insist that excess demand (‘demand-pull’) is the cause. For example, even as the RBI hikes interest rates in order to curb inflation, it calls on the Government to hike domestic prices of petroleum products.36 The RBI, the Chief Economic Adviser (Kaushik Basu), and the Prime Minister’s Economic Advisory Council (PMEAC) all argue that not hiking petroleum products prices would mean a higher fiscal deficit (i.e., Government borrowing) – and that would add to excess demand, and thus result in higher inflation. In other words, so firmly and religiously do these gentlemen advance their theory of excess demand, that they are willing to directly bring about cost-push inflation (by raising petroleum prices) in order to avoid the indirect (and imaginary) threat of demand-pull inflation! The latest increases in the prices of petroleum products have thus given overall prices another boost when people have been reeling under relentless price rise. In fact, of course, there is no need to either incur a higher fiscal deficit or hike petroleum products prices. The Government made much of the fact that, along with the price hike, it reduced some of the indirect taxation on petroleum products, thus reducing the extent of the latest hike. All it needs to do in order to avoid any hike in petroleum prices is to further reduce, or eliminate, these giant taxes. The contribution of the petroleum to the central exchequer rose from Rs 112,000 crore (Rs 1.22 trillion) in 2009-10 to Rs 136,000 crore (Rs 1.36 trillion) in 2010-11; state government taxes were an additional Rs 72,000 crore (Rs 720 billion) and Rs 80,000 crore (Rs 800 billion), respectively.37 In order to make up the revenue it would lose by such a reduction, the Government could simply hike direct taxes on the corporate sector and the rich, or hike indirect taxes on luxury commodities (additional taxes on automobiles and their use would also help to curb the waste of petroleum). That, however, would go against the class interests the rulers represent, and so is ruled out. Why do we find that the rulers’ only response to inflation today is a hike in interest rates? It has little to do with the causes of inflation in recent years. The fact is that, as a result of the post-1991 liberalisation, privatisation and globalisation policies, the crisis of Indian agriculture has deepened (we have spelled out the reasons for this in several past issues of Aspects). At the same time, speculative forces have been strengthened by these very policies: regulations on movement and storage have been eased, State agencies’ intervention in agricultural markets has been withdrawn, commodity futures markets have been set up to host speculation, and finance has been made easily available for speculators. As a result, any period of sustained growth tends to trigger inflation. Moreover, the greater integration of the Indian economy with the world economy means that speculative surges on international commodity markets send signals to speculators here, too. Under a pro-people order, inflation could be curbed by direct State intervention to boost agricultural investment and production, suppress speculation, expand public procurement and distribution, ration scarce essentials (especially if these are imported), reduce the burden of taxation on petroleum imports, and insulate the domestic economy from global swings. However, the present dispensation and reigning policies rule out such State interventions. As a result, the only instrument left with the rulers to address inflation is to raise interest rates in order to curb growth and depress demand. If this does succeed in bringing prices under control, it would do so in the most painful way possible, by reducing employment and wages, and thus demand; but in fact it may not be successful in doing so, as we have seen over the past 15 months, which has seen 16 interest rate hikes with little effect on prices. Contradiction between financial and industrial interests The contrary is the case for financial interests: since financial assets are denominated in, say, rupees, when the real value of the rupee falls with inflation, so does the value of financial assets. Hence holders of financial assets abhor inflation. For obvious reasons, they promote deflationary policies, which will lead to the value of financial assets rising. If the Indian government were to disobey the dictates of foreign financial investors, and decline to raise interest rates today, foreign investors would start taking their money out of the country, triggering a crisis. Hence the interest rate hikes are in particular a sign of the increasing domination of foreign finance over India’s economy. It should be noted that even if the economy is sent into recession as a result of deflationary measures, financial interests stand to make certain other gains: In a recession, financial investors, particularly foreign financial investors, are able to buy up physical assets – land, factories, mines, and physical infrastructure – at rock-bottom prices. Thus the deflationary IMF packages imposed on East and Southeast Asia after the 1997-98 crisis handed US and other foreign investors a bonanza, as they took over firms and other assets throughout the region. However, the interests of the two camps cannot be entirely demarcated. After all, financial investors stand to gain when industrial/commercial firms make big profits: dividends flow and share prices rise, firms engage merchant banks for share issues, mergers/acquisitions, and raising debt. The same holds for the other side: most big industrial/commercial groups now also have their fingers in the financial pie, owning financial firms and placing their idle cash in the share market whenever possible. The rulers, in balancing the two sets of interests, adhere to the broad directions of financial interests in monetary and fiscal policy, even at the cost of triggering a slowdown, but compensate large industrial and commercial interests by carving out special profit-making opportunities, subsidies and outright gifts to them. VII. In the Name of Countering the Slowdown Now that the corporate sector is experiencing a slowdown, the Government has sprung into action. First, it is expediting schemes intended to line the pockets of the corporate sector at the expense of the public exchequer. For example, the road ministry has asked for Cabinet approval to spend Rs 60,000 crore (Rs 600 billion) this fiscal year in upgrading national highways – a sum double that spent last year, and nearly equivalent to that spent over the last three years on this head. A senior ministry official says: “Since now we have been directed by the prime minister to process more stretches to accelerate the awarding and construction, we hope the proposals will be cleared fast”.38Secondly, the slowdown will be used as an excuse for demolishing environmental regulations and procedures. The Reserve Bank recently took the unusual step of demanding that, in order to reverse the decline in foreign direct investment (FDI), the Government “expedite the reform process” and speedily remove obstacles such as environmental clearances and “land acquisition issues”:
The RBI’s touching concern for investor sentiments did not extend to the sentiments of those who are to be displaced, their environment destroyed, for foreign investment. Echoing the RBI, the Planning Commission recently warned that GDP growth target of 9 per cent for the 12th Plan would require 100,000 MW of new power capacity, but, among other obstacles, “Forest and environment clearance procedures are hindering both coal availability and hydro-power development”.40 The Prime Minister’s Economic Advisory Council (PMEAC) has chimed in, calling for “permitting exploratory mining in forest areas.”41 Most strikingly, the Prime Minister himself said on July 24 that environmental clearances had become a new form of “licence-permit raj”. The press has quickly picked up the theme. The Times of India warns that “projects are being held up by Hamletian dithering on the part of the environment ministry. Investors are, understandably, losing confidence in a policy environment where the rules of the game can change without warning.... the Government needs to act now.”42 This, when 535 projects received environment clearances and just 6 were rejected during the 11-month period August 2009 to July 2010, as fast as during 2006-08.43 In June 2011 itself, Jairam Ramesh provided evidence of his cooperativeness by clearing 6 coal blocks for power projects in environmentally sensitive (‘no-go’) areas. Nevertheless, for good measure, the high-profile Ramesh has been replaced as environment minister by a more conventional party faithful who has already signalled her willingness to move clearances even faster than her predecessors. As we write this, the Group of Ministers is soon to meet to further relax restrictions on coal mining in environmentally sensitive areas. What is remarkable is that those demanding the relaxation of such restrictions – the RBI, the Planning Commission, and so on – do not bother to contend that no serious damage will be done to the environment. They merely take as given the priority of “investor sentiments” over all other concerns. Drumbeat for fresh round of ‘reforms’
The publisher-chairman of Business Standard weighed in with a signed editorial:
The secretary-general of the Federation of Indian Chambers of Commerce and Industry (FICCI), Rajiv Kumar, laid out the logic bluntly: FICCI has a longer wish list, including the stalled goods and services tax (GST), financial sector and education ‘reforms’. All face opposition, Kumar admits: “The implementation of these reforms, however, requires broader political consensus that can only happen if political parties set aside opportunistic considerations in deference to national welfare.”47 The Prime Minister’s Economic Advisory Council (PMEAC) too has called for a fresh round of “reforms”: “It is important to push through the reform agenda.... to achieve a stable 9 per cent rate of economic growth”. Perturbed at “apparent signs of slowing down of foreign investment flows”, the PMEAC stresses: “we need to focus on enhancing FDI flows. Though a majority of sectors have been liberalised,... there are a few issues whose resolution will pave the way for larger flows.... we need to be proactive in promoting the flow of such investment.”48 At the international level, UNCTAD’s latest World Investment Report 2011 has warned that “In India, the setback in attracting FDI was partly due to... delays in approval of large FDI projects; these factors are hindering the Indian government’s efforts to boost investment...” Pressure from abroad Indian finance minister Pranab Mukherjee highlighted that “discussions are underway to build consensus on further liberalisation of the foreign direct investment (FDI) policy in retail and defence sectors”, and that “ownership and control are now central to the FDI policy” – that is, remaining restrictions on extent of foreign ownership in certain sectors such as retail and insurance would go. Senior Indian officials explained that while “There are issues such as land acquisition, environmental clearances, rehabilitation of displaced persons, which cause concern on account of their potential to introduce time and cost overrun.... There is a sustained and continuous policy churn which is happening in these areas, with a view to resolving these impediments.”49 Policy onslaught (i) A Land Acquisition Bill is on the cards. It is likely to contain some apparent concessions to the popular resistance faced by land acquisition and mining over the past five years; these concessions may involve some increased pay-outs to the affected. However, the main purpose of the Bill is to remove legal and political obstacles to the drive for land acquisition. The broader negative consequences of this drive – to the displaced families, to agricultural production, and to the environment – will not be alleviated by providing some of the affected some more cash (if indeed they finally receive it). The draft Land Acquisition Bill posted by the Ministry of Rural Development on its website in August 2011 retains full power for the State to acquire land for any governmental purpose (including, presumably, ‘Public-Private Partnerships’, or PPP); defines “public purpose” sweepingly to include “any other purpose useful to the general public, including land for companies”; and takes as its overarching objective the facilitation of acquisition of land for industry and urbanisation, rather than the minimisation of such acquisition. Unsurprisingly, the corporate sector and their media have welcomed the Bill. (ii) On June 9, a top ministerial committee headed by the prime minister gave its in-principle approval to the draft Manufacturing Policy, the centrepiece of which is the proposal for National Manufacturing and Investment Zones (NMIZs). NMIZs are to be on the lines of the Special Economic Zones (SEZs), except that there is no requirement of export. Like the SEZs, the NMIZs will be virtually foreign territory for the Indian State. State governments are to provide land, water, and external infrastructure; a Developer is to take over most of the remaining functions of the State within the NMIZ. Two key features of the proposed NMIZ are (1) the effective suspension of the entire gamut of labour laws – relating to retrenchment, regularisation of contract labour, the limit on hours per shift, the right to join unions, the maintenance of workers in ‘temporary’ status, the employment of women in three shifts, closure (i.e. an ‘exit policy’), and so on; and (2) the demolition of environmental regulation – no less than 42 changes are proposed, relating to 14 Acts. A large number of the changes concern mining, forest clearance, compensatory afforestation, restricting the number and scope of public hearings, and so on. It appears that any hurdles to obtaining environmental clearance through the normal channels can be overcoming by declaring the project an NMIZ.50 The new environment minister, Jayanthi Natarajan, has signalled her willingness to help the NMIZ scheme go through. The labour ministry has maintained the formal position that existing labour laws will continue to apply, but has nevertheless given its go-ahead to the proposal, saying that whatever “issues” it had with the proposal have been “resolved”.All this is being done, of course, in the name of increasing employment in the manufacturing sector – a claim which is entirely bogus, since the corporate sector accounts, as we have seen, for only a small share of manufacturing employment, whereas the labour-intensive sector, which accounts for the bulk of manufacturing employment, is being crushed by the reigning policies. (iii) On May 27 the inter-ministerial group headed by chief economic adviser Kaushik Basu recommended the opening of multi-brand retail to foreign direct investment and the revision of the APMC. As we go to press, the Committee of Secretaries has recommended allowing up to 51 per cent FDI in multi-brand retail; a final decision is now to be taken by the Union Cabinet. A proper discussion of the implications of this step requires a separate article. However, the consequences for employment are profound. The retail sector provides employment to 7.2 per cent of India’s workforce, or at least 33.1 million persons,51 and these figures have risen in the period of liberalisation, when few jobs were available elsewhere. Now this is set to change dramatically with the entry of foreign giants into multi-brand retail. We can get an idea of the impending changes by looking at the situation in similarly underdeveloped countries where the entry of foreign retail has taken place in recent years. Organised retail accounted for 10-20 per cent of food retail in Latin America in 1990; by 2000, it had risen to 50-60 per cent, almost approaching the 70-80 per cent share in the US or France. One study notes: “Latin America had thus seen in a single decade the same development of supermarkets that the United States experienced in five decades.” The same pattern is being repeated, with lags, in East/Southeast Asia and Central Europe, southern and eastern Africa, and now south Asia and western Africa. Organised sector retail in these regions is “increasingly and overwhelmingly multinationalized (foreign-owned) and consolidated”, i.e., the bulk of the market share is concentrated among four or five firms.52 Suppliers have to alter their production processes and make sizeable investments to conform to the requirements of these retail giants:
For the same reasons as apply to small farms, small industrial firms, too, will find it near-impossible to meet the requirements of organised retail, in competition not only with domestic big industry but multinational retail’s global network of suppliers. Since these small firms are relatively labour-intensive, the shift of their market share even to domestic large industry would reduce overall employment; a shift to imports would do so even faster. The reduction in employment, then, takes place not only directly in the retail sector but also in the commodity-producing sectors, agriculture and industry. In this fashion, the ‘renewal of reforms’ being pursued by the Government, at the direction of international and domestic big capital, intensifies the crisis of employment and further immiserises the vast majority. It also accelerates the massive handover of natural resources to the corporate sector and the destruction of the environment and the future economy of India. That this is done under the banner of reviving ‘growth’ starkly illustrates the dualism of India’s economy. Regardless of the Indian rulers’ strenuous efforts to revive ‘growth’ by integrating the Indian economy more closely with imperialism, the downturn and turmoil in the all the imperialist countries is bound to have a depressing impact on the Indian economy. Of course, it cannot be ruled out that, for some other reason, the pace of corporate-led growth in India might revive by the end of the year – for example, if the Government decides to intervene massively once more. At any rate, even the reduced GDP growth rates being talked of for India – in the range of 7.5 to 8 per cent – are high. As we have seen, however, such ‘growth’ is antagonistically related to India’s national, democratic and sustainable development. Rather than mourn the slowing of this ‘growth’, then, we need to focus our energies on bringing about a social order that is addressed to meeting people’s needs (and, correspondingly, suppressing frivolous and wasteful consumption); generating employment that absorbs the large potential labour force and develops people’s true creative potential; carefully husbanding what remains of the country’s natural wealth; protecting its future; and building social relations that allow human beings to relate to one another as human beings, so that we can collectively address the problems that confront us.
Notes: 1. In the old series of the IIP, base year 1993-94. In the new series, base year 2004-05, the figures are 5.6 per cent for May 2011 and 8.5 per cent for May 2010, still a slowdown, though not as steep. (back) 2. Utsa Patnaik, The Republic of Hunger and Other Essays, p. 200. (back) 3. See http://www.ophi.org.uk/wp-content/uploads/OPHI-MPI-Brief.pdf. (back) 4. Economic Survey, 2101-11. From 27.96 million in March 2000 the figure fell to 27.55 million in March 2008. (back) 5. Current Daily Status basis employment rose from 336.8 million in 1999-2000 to 401.4 million in 2009-10. (back) 6. By Usual Status (ps+ss). http://mospi.nic.in/Mospi_New/upload/Press_Note_KI_E&UE_66th_English.pdf. (back) 7. Kaushik Basu, “India’s demographic dividend”, http://southasia.icicp.org/wp-content/uploads/2010/06/Indias-Demographic-Dividend.pdf. (back) 8. Hindu, 3/3/11. (back) 9. http://www.ercindia.org/rtiresp.php. (back) 10. Times of India, 7/5/11. (back) 11. Partha Dasgupta, “Nature’s role in sustaining economic development”, Philosophical Transactions of the Royal Society, 2010, http://rstb.royalsocietypublishing.org/content/365/1537/5.full. (back) 12. Business Standard, 14/6/11. (back) 13. C. P. Chandrashekhar, Jayati Ghosh, The Market that Failed, 2000, p. 59. (back) 14. RBI, Report on Currency and Finance, 2008-09, p. 195. (back) 15. RBI, Annual Reports, 2005-06 and 2008-09. (back) 16. The main reasons for the slowdown were (i) the RBI’s attempt to control inflation by hiking interest rates repeatedly; (ii) the tendency of demand for luxury goods and services to peter out after a burst of rapid growth; and (iii) the rise in the exchange rate of the rupee as a result of large inflows of foreign capital. (When large inflows of foreign capital take place, beyond the requirements of meeting the deficit on trade in goods and services, the exchange rate of the rupee rises, i.e., you can buy a dollar with fewer rupees. As a result, India’s export prices rise in dollar terms, and hence become less competitive globally; meanwhile imports into India become cheaper in rupee terms, and hence take away a larger share of the market from domestic producers. The RBI Annual Report 2009-10, p. 72, calculates that a one per cent real appreciation in the value of the rupee leads to a 0.7 per cent worsening of the trade deficit. Thus a rise in the rupee value in the present context depresses domestic production.) (back) 17. http://www.livemint.com/2010/08/29214036/Total-number-of-CDR-cases-sees.html?d=2 (back) 18. That is, the growth of “community, social and personal services”, reflecting mainly Government services, rose from 2.9 per cent in 2006-07 to 6.9 per cent in 2007-08, 12.7 per cent in 2008-09 and 11.8 per cent in 2009-10. It fell to 5.7 per cent in 2010-11. The ‘value added’ in this sector is measured by the salaries of its employees.That is, the growth of “community, social and personal services”, reflecting mainly Government services, rose from 2.9 per cent in 2006-07 to 6.9 per cent in 2007-08, 12.7 per cent in 2008-09 and 11.8 per cent in 2009-10. It fell to 5.7 per cent in 2010-11. The ‘value added’ in this sector is measured by the salaries of its employees. (back) 19. RBI, Macroeconomic and Monetary Developments, 2008-09, 2009-10, 2010-11. (back) 20. Hindu Business Line, 6/1/10. (back) 21.Tata Steel, Annual Reports, 2009-10 and 2010-11. (back) 22. Expenditure on the only public works programme, the National Rural Employment Guarantee Scheme, rose from 0.29 per cent of GDP in 2007-08 to 0.66 per cent of GDP in 2008-09. Not only was this is a paltry stimulus, but it thereafter actually declined as a share of GDP in the following two years, 2009-10 and 2010-11. (back) 23. In the 1993-94 series of the IIP. The new series, with the base year 2004-05, also shows a decline, though not as steep. (back) 24. In the 1993-94 series of the IIP. In the new series, base year 2004-05, durables production rises in 2007-08, and falls the following year. (back) 25. The weighted contribution of consumer durables, which constitute 5.37 per cent of the IIP (1993-94 series), was 20 per cent and 21 per cent in April-December 2009 and April-December 2010, respectively. According to the minister for heavy industries, the automotive sector now accounts for 22 per cent of manufacturing in India http://smehorizon.sulekha.com/praful-patel-meets-with-captains-of-indian-automotive_automotive-viewsitem_3809. (back) 26. RBI, Macroeconomic and Monetary Developments in 2010-11, May 2011. (back) 27. Hindu Business Line, 22/6/11. (back) 28. CRISIL Research, 28/6/2011, http://www.crisil.com/Ratings/Brochureware/News/CRISIL-Research-inflation-pr_280611.pdf?cn=null (back) 29. One reason for the fall in durables prices is that many of these have a high import content, and with the rupee gaining in value against the dollar over the past two years thanks to large capital inflows, the rupee price of these imports would have fallen. (back) 30. The services sector(24.4 per cent), personal loans (18.8 per cent) and medium-scale industry (5.1 per cent) accounted for the remaining credit. It is significant that personal loans – for buying homes, cars, college education abroad, consumer durables, and so on – account for as much bank credit as agriculture and micro and small industry put together! Source: RBI, “Deployment of Gross Bank Credit by Major Sectors”. (back) 31. It is interesting to note that in fact small industry is generally forced to extend interest-free credit to large industry whenever it supplies the latter inputs: large industry routinely delays its payments by months, particularly when it needs credit. (back) 32. Bank credit to the services sector grew by 21.8 per cent, as compared to 15 per cent the previous year; and lending for consumer durables rose 17.7 per cent, up sharply from 5.6 per cent the previous year. Within consumer durables, vehicle loans rose by 23.9 per cent. (back) 33. NCEUS, “The Global Economic Crisis and the Informal Economy in India: Need for urgent measures and fiscal stimulus to protect incomes in the informal economy”, 2008, http://nceuis.nic.in/Global_Economic_crisis.pdf. (back) 34. RBI, Annual Report 2009-10, p. 18. (back) 35. RBI, Report on Currency and Finance, 2008-09, pp. 242-292. (back) 36. See “Macroeconomic and Monetary Developments in 2010-11.” (back) 37. People’s Democracy, 3/7/11, and Website of the Petroleum Planning and Analysis Cell (PPAC), http://ppac.org.in/ (back) 38. Times of India, 16/6/11. (back) 39. RBI, “Monetary and Macroeconomic Developments, 3rd Quarter 2010-11”. (back) 40. Planning Commission, “Issues for the Approach Paper to the 12th Plan”. (back) 41. PMEAC, Economic Outlook 2011-12, July 2011. (back) 42. Editorial, 8/7/11. (back) 43. http://www.ercindia.org/rtiresp.php. (back) 44. Lead editorial, Business Standard, 17/5/11, emphasis added. (back) 45. Lead editorial, Business Standard, 1/6/11. (back) 46. T.N. Ninan, Business Standard 21/5/11. (back) 47. Hindu Business Line, 25/6/11. (back) 48. PMEAC, op. cit. (back) 49. Secretary of the Department of Economic Affairs R. Gopalan. (back) 50. http://dipp.nic.in/NMP_DiscussionPaper/NMP_DiscussionPaper_2010.pdf (back) 51. The figure is for 2007-08. Discussion Paper on FDI in Retail Trade, Department of Industrial Promotion and Policy, 2010, p. 5. (back) 52. Thomas Reardon, Peter Timmer and Julio Berdegue, The Rapid Rise of Supermarkets in Developing Countries: Induced Organizational, Institutional, and Technological Change in Agrifood Systems,Eelectronic Journal of Agricultural and Developmental Economics, Food and Agricultural Organisation (FAO), vol. I, no. 2, 2004. (back) 53. Ibid. (back)
NEXT: Nationality vs. Partition – Suniti Kumar Ghosh'
|
||||||||||||||||||||||||||||||||||||||||||||||||||||||||||||||||||||||||||||||||||||||||||||||||||||||||||||||||||||||||||||||||||||||||||||||||||||||||||||||||||||||||||||||||||||||||||||||||||||||||||||||||||||||||||||||||||||||||||||||||||||||
|
| Home| About Us | Current Issue | Back Issues | Contact Us | |
|||||||||||||||||||||||||||||||||||||||||||||||||||||||||||||||||||||||||||||||||||||||||||||||||||||||||||||||||||||||||||||||||||||||||||||||||||||||||||||||||||||||||||||||||||||||||||||||||||||||||||||||||||||||||||||||||||||||||||||||||||||||
|
All material © copyright 2015 by Research Unit for Political Economy |
|||||||||||||||||||||||||||||||||||||||||||||||||||||||||||||||||||||||||||||||||||||||||||||||||||||||||||||||||||||||||||||||||||||||||||||||||||||||||||||||||||||||||||||||||||||||||||||||||||||||||||||||||||||||||||||||||||||||||||||||||||||||