No. 54, June 2013
| |
|
|
No. 54, June 2013 |
|
|
No. 54 Balance of Payments: The Political-Economic Background Questioning the Official Power Policy Whose Agenda? US Strategic Interests, India, and Sri Lankan War Crimes
|
The External Crisis The entire liberalisation process since 1991was meant to render India internationally competitive and overcome the balance of payments difficulties which had plagued it in one form or another since the mid-1950s. It has instead deepened India’s dependence on foreign capital, increased foreign ownership of Indian assets, and strengthened foreign dictation of Indian economic policy. The part played by the IMF and World Bank in 1991 has now been taken over by credit rating agencies, whose employees extensively monitor Indian policy-making and spell out the demands of foreign capital. [Note: one lakh = one hundred thousand; one ‘crore’ = 10 million; one lakh crore = one trillion] I. Using the crisis Since January the Finance Minister has been on a hectic roadshow across the world – Singapore, Hong Kong, Dubai, Frankfurt, London, Tokyo, Toronto, Ottawa, Boston, and New York. The stated purpose has been to reassure foreign investors regarding the economic policies and political stability of the Indian government, and to attract fresh investments. It may well be that in the last four months he has spent more time abroad than in the country. This relentless cabaret speaks of a certain desperation. In part, this display of desperation is deliberate: the Government is using the crisis of the current account deficit as a means of pushing through various policies that have been facing resistance. Thus opening the multi-brand retail sector to foreign direct investment (FDI), raising the entire range of energy prices (diesel, gas, coal, etc), and granting permission for mining in ecologically sensitive regions – all these have been justified by pointing to the need to reduce imports and attract foreign capital. Similarly, the massive cuts in social expenditure in 2012-13 were justified simply by saying that credit rating agencies would have downgraded India had the fiscal deficit not been slashed. Recently a well-known economist, a fixture in Government committees, called this a “crisis too good to waste”:
In his speech to the nation last September justifying the decision to hike petroleum product prices and to open the multi-brand retail sector to foreign firms, Manmohan Singh conjured up the spectre of the 1991 crisis: “If we had not acted... domestic as well as foreign investors would be reluctant to invest in our economy.... The last time we faced this problem was in 1991. Nobody was willing to lend us even small amounts of money then... we must act before people lose confidence in our economy....” Thus there is an element of deliberate exploitation of the crisis. Nevertheless, it cannot be denied that there also is a crisis. Before going into the facts, it is useful to go over the meanings of certain terms. II.Explaining some terms The balance of payments (BoP) is a set of accounts of a country’s financial transactions with the outside world. Like any set of accounts, it has a number of items, against which there are credits and debits. When all the items are added up, they must total zero – i.e., any deficit must be made up from somewhere, and any surplus must end up somewhere. (a) ‘Merchandise trade’ is trade in visible commodities – things you can see, such as agricultural goods, petroleum, textiles, motor cars, and machinery. India earns less on merchandise exports than it spends on merchandise imports; thus it incurs a merchandise trade deficit. (b) Apart from merchandise trade, there are three other types of current receipts from, and payments to, those abroad. First, services: for example, receipts from travel here by foreigners and payments for travel abroad by Indians; or earnings on IT-enabled services such as software and call centres, and payments for import of software. Secondly, transfers: in the main, remittances to India by Indian workers abroad and remittances out of India by foreign individuals in India. Thirdly, investment income: receipts on Indian investment (including loans) abroad and payments on foreign investments (including debt) in India. Because these three types of receipts/payments are not for visible commodities, they are all part of the ‘invisibles’ account. India receives much more on the invisibles account than it pays out, thanks to its relatively cheap labour (that is, its exports of software and software workers, and the sweated labour of Indian workers in the Gulf). Hence, in the net, India enjoys an invisibles account surplus. (c) When you add the merchandise trade (i.e., visible trade) account and the invisibles account, the sum is the ‘current account’ (so called because the sums paid/received generally relate to the current period). In India’s case, its merchandise trade deficit is generally larger than its invisibles surplus; hence India usually runs a current account deficit (CAD). (d) When a person spends more than he/she earns, he/she has to either pay out of some money set aside for a rainy day, or borrow in order to make payments. Similarly, when a country runs a current account deficit, it must either draw down its foreign exchange reserves, or attract capital inflows of investment/debt/grants. On the other hand, capital outflows take place when Indians invest abroad, or when foreign investors sell off their holdings here and withdraw their capital. India’s capital inflows are generally larger than its capital outflows, giving us a positive net figure on the capital account, or a capital account surplus. (e) The current account plus the capital account gives us the ‘balance of payments’. If there is a surplus in the balance of payments, the country’s foreign exchange reserves must grow; if there is a deficit, the foreign exchange reserves must be drawn down. Thus:
Because of its capital account surplus, India has been able to bridge the current account deficit without drawing down its foreign exchange reserves. However, such capital inflows – whether in the form of portfolio investment, or foreign direct investment (FDI), or debt – come at a price: Payments on those inflows (whether in the form of profit or interest) flow out. That outflow, as we saw above, shows up in the current account. So the very ‘success’ in attracting capital inflows may result in a higher current account deficit, requiring more capital inflows to bridge the gap. Moreover, there are various types of capital inflows. Some are relatively long-term, and are tied up in assets here which are difficult to liquidate at short notice. Some others are short-term debt, the official definition of which is that they are to be repatriated within a year. Yet other forms of capital inflow can be withdrawn at any time, instantly. The larger the share of short-term or instantly repatriable inflows in total inflows, the more volatile will be the capital account, and the more vulnerable the country will be to the movements of financial capital (foreign or Indian).
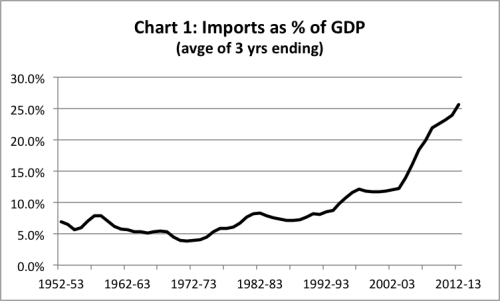
III. Runaway growth of imports, trade deficit Now let us turn to the facts. Let us look at the scale of imports; the merchandise trade deficit; the current account; and the capital account. Imports/GDP: As we can see from Chart 1, with the beginning of liberalisation in the 1980s (India took an IMF loan in 1981), there was a sharp rise in the imports/GDP ratio. This is partly understandable, as oil prices rose sharply in 1980. However, oil prices plummeted thereafter: Brent crude fell from $36.83/barrel in 1980 to $14.43 in 1986. Nevertheless the imports/GDP ratio during the 1980s stayed at a much higher level than in the 1970s. In the decade after the second IMF loan in 1991, imports/GDP rose even more sharply; and in the decade of ‘runaway growth’, the 2000s, the ratio soared.[2]
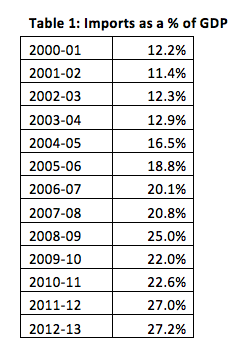
Table 1 gives the figures from 2000-01 on. We can seefrom this table that the sharp rise dates to the start of the boom period, i.e., from 2003-04 on. By 2008-09, the ratio is double that of 2003-04; then there is a brief and limited dip as a result of the slowdown; but by 2011-12 the ratio has soared to even higher levels than the earlier peak. Imports are now more than a quarter of GDP, implying a very high level of external dependence and vulnerability of the economy. (By way of comparison, the import/GDP ratio for the United States was 15 per cent in 2011.)
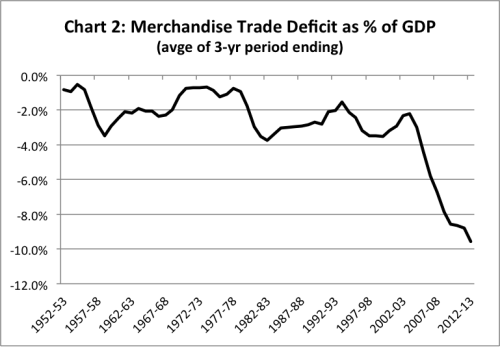
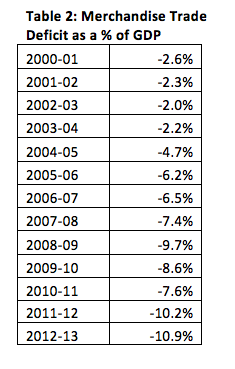
Merchandise trade deficit/GDP: While the exports/GDP ratio also rose in this period, it could not match the steep rise in the imports/GDP ratio. Hence the merchandise trade deficit too rose as a percentage of GDP. As we can see from Chart 2, the merchandise trade deficit/GDP ratio deteriorated sharply at the start of the 1980s due to the oil price hike. Thereafter, despite the fall in oil prices, the merchandise trade deficit remained much larger throughout the 1980s than it had been in the earlier decade. This culminated in the foreign exchange crisis of 1990-91, at which point the merchandise trade deficit was 2.9 per cent of GDP. As a condition for extending a loan to India, the IMF imposed a ‘structural adjustment’ programme on India that began in 1991-92. The IMF and the Government claimed this programme would reorient the economy so as to increase exports and reduce the trade deficit. In the initial three years of the programme, imports were compressed to some extent, bringing down the trade deficit. But thereafter it began rising again to the earlier levels, and the average for the second half of the decade (1995-96 to 1999-2000) was 3.5 per cent, i.e., considerably higher than in the crisis year of 1990-91. In absolute terms, in 1999-2000, the merchandise trade deficit was $17.8 billion, compared to $9.4 billion in 1990-91. Hence, had it not been for two developments that had nothing to do with the structural adjustment programme, namely the revival of remittances from Indian workers abroad, and later the export of software, the country would have landed in another foreign exchange crisis by the early 2000s despite a decade of ‘structural adjustment’.
What is remarkable is that even the slowdown in the economy since 2011-12 has not reduced the import/GDP ratio or the trade deficit/GDP ratio; rather, these ratios have increased sharply. That indicates that the demand for imports is arising from sections whose incomes are not affected by the slowdown, or who at least have the capacity to spend despite it.
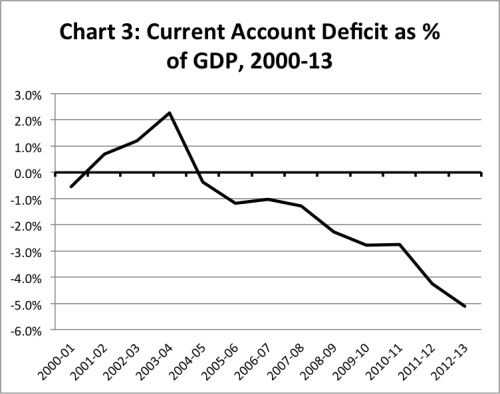
Current account deficit/GDP: Despite the high merchandise trade deficit during the 1990s, the current account deficit actually shrank over the course of that decade. The reason was the rise of invisibles receipts. The mainstay of invisibles receipts in the 1980s had been the export of cheap labour power to the Gulf; while this was briefly interrupted due to the first Iraq war and its consequences, it soon revived after the war ended. By the end of the 1990s, earnings from Gulf labour were joined by two new forms of export of cheap labour power: the export of software services using new communications technology, and the export of software workers on short-term visas to the US. The combined growth rate of two items – exports of Information Technology Enabled Services (ITES) and workers’ remittances – averaged 24 per cent between 2001-02 and 2007-08. As a result, invisibles receipts rose so sharply that during 2001-02 to 2003-04 India actually ran a current account surplus.[3] However, in recent years the invisibles account miracle seems to be fading. The net invisibles surplus peaked at 7.4 per cent of GDP in 2008-09. Thereafter it fell to 5.8, 4.9, 6.0, and 5.7 per cent respectively in the next four years. The Prime Minister’s Economic Advisory Council (PMEAC) projects that the invisibles surplus will fall to 5.3 per cent in 2013-14. The combined growth rate of ITES-related exports and workers’ remittances fell to 4 and 8 per cent in 2009-10 and 2010-11 respectively. It recovered to 20 per cent in 2011-12, but then fell again to an estimated 4 per cent in 2012-13. The future of ITES-related exports, as a mainstay of India’s invisibles receipts, is uncertain. Meanwhile, as mentioned earlier, the merchandise trade deficit, which grew rapidly in the period of rapid growth, continued to rise in the period of slowdown as well. It has peaked in 2012-13. As a result, the invisibles surplus covered less and less of the merchandise trade deficit. Thus, whereas the invisibles surplus covered 92.6 per cent of the merchandise trade deficit in 2004-05, that figure fell to just 52.9 per cent in 2012-13. As the invisibles surplus has fallen and the merchandise trade deficit has kept rising, the current account deficit has risen to historically unprecedented levels. Before 2011-12, the highest current account deficit/GDP recorded in all of post-1947 India had been in 1957-58 (3.1 per cent) and 1990-91 (3.0 per cent). In 2011-12, however, it reached 4.2 per cent; in 2012-13, over 5 per cent (the final figure has not yet been released). It is worth noting that the RBI itself considers a current account deficit/GDP ratio over 2.5 per cent to be unsustainable.
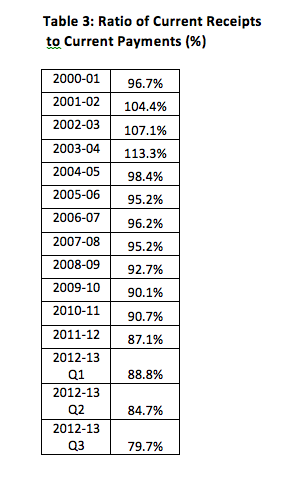
Another useful way to present the data is the ratio of total current receipts to total current payments. This gives us (i) a measure of how much current receipts (principally exports of goods and services, and worker remittances) have to expand in order to pay for current payments; and (ii) whether the gap is closing or growing. As can be seen from Table 3, since 2004-05, the gap has been steadily growing. For receipts to expand fast enough to close the gap, they would have to grow at near-impossible rates. For example, let us say the ratio is 85 per cent in 2012-13, and current payments rise in 2013-14 by 25 per cent.[4] Current receipts would have to rise 47 per cent in order to close the gap. If, instead, as is more likely, they rose only 21 per cent,[5] the ratio would sink to 82 per cent. That is, the mountain to be scaled would become even higher. This points to a conclusion we will return to later: namely, that the only way to scale this mountain is not to attempt to clamber up, but to reduce its size, i.e., reduce imports and invisibles payments.
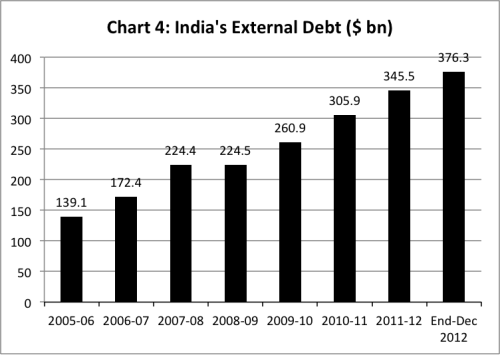
IV. Massive build-up of foreign liabilities How is this giant current account deficit ($94.2 billion in 2012-13) being financed? At the moment, by an equally large capital account surplus – foreign investment and foreign debt. Policy-makers are unperturbed by this level of dependence on large capital inflows, which are additions to the stock of India’s foreign liabilities. In the words of the chairman of the Prime Minister’s Economic Advisory Council, “financing the current account deficit has not been a problem. In 2012-13, India attracted as much as $94 billion. This shows the trust investors and others placed in India.”[6] It is revealing that official economists like Rangarajan ring the alarm bell when the fiscal deficit (i.e., Government borrowings, largely domestic) rises, or even if it does not fall as fast as they want it to; but they see no problem when the current account deficit has to be financed by ever-larger capital inflows. Actually, from the angle of national interest, the reverse should be the case: the growth of Government borrowings from domestic parties is not necessarily alarming, whereas the growth of India’s foreign liabilities is alarming. The reason is that increased Government spending (financed by domestic borrowing, a large part of it from public sector institutions), especially when it goes toward investment, can lead to increased domestic economic activity. Apart from being desirable in itself, this increased activity also generates additional tax revenue, which reduces the need for further Government borrowing. Whereas a growing current account deficit, financed by taking on fresh foreign liabilities, does not as such generate any additional foreign exchange with which to service the foreign liabilities. The servicing of the fresh foreign liabilities adds to the current account deficit, which may necessitate even larger capital inflows in the next round. Rangarajan says that the capital inflows of $94 billion in 2012-13 show the trust investors and others placed in India; but that implies that, if their trust is shaken, India would be unable to cover its current account deficit with capital inflows. Consider what happened in the second half of the 1980s. As the Government liberalised imports and industrial licensing, imports grew faster than exports. Then, too, it seemed for a while that there was no problem in financing the current account deficit with external commercial borrowings, no doubt a sign of the “trust” reposed in India by foreign creditors. However, it very quickly became evident that India was entering a debt trap. A 1988 study noted: “If adequate and timely adjustments are not initiated now,the possibility of more painful adjustments being forced on us later, similar to the Latin American type, cannot be ruled out”.[7] The external debt doubled, from $40.6 billion in 1985 to $85.7 billion in 1990. While the quantum of external commercial borrowings rose, the debt-servicing payments on these borrowings too rose so steeply that by 1990-91, after subtracting debt-servicing payments, the net transfer on commercial borrowings turned negative. That is, there was a net outflow from India instead of an inflow on account of commercial borrowings. At that point, India’s merchandise trade deficit was 2.9 per cent of GDP. Despite the fact that the trade deficit had been considerably higher earlier in the same decade, India had been able to fund it with foreign borrowings. In 1990, however, international credit ratings agencies made their presence felt for the first time in India: when they downgraded India, it became near-impossible for it to get fresh commercial borrowings. India was forced to go to the IMF for a loan, forcing a “Latin American type” structural adjustment. In other words, the availability of foreign finance today is no guarantee of its availability tomorrow. India’s total external debt has risen steeply, from $225.5 billion in March 2009 to $345.5 billion in March 2012 and $376.3 billion in December 2012. Apart from external debt, foreign investment (i.e., FDI and portfolio investment in equity) also constitute liabilities which entail payments. Thus India’s gross foreign liabilities (foreign debt plus foreign investment) have shot up from $409 billion in March 2009 to $723.9 billion in December 2012.
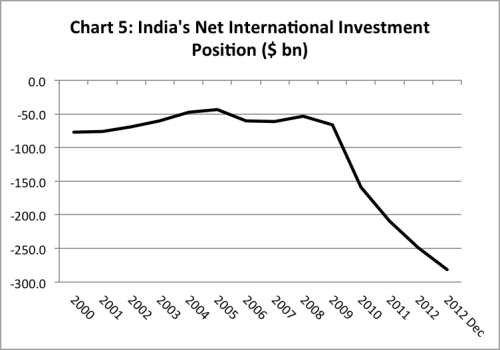
True, India also has foreign assets, but these have risen much more slowly. Let us look at India’s net external liabilities. That is, India’s international assets (its loans to others and its investments abroad) minus its international liabilities (India’s external debt and foreign investment in India). In the last decade, India’s net external liabilities have grown dramatically: from $66.6 billion in March 2009, net external liabilities have quadrupled to $282 billion by December 2012 (see Chart 4).
Two developments have taken place on the investment account (i.e., foreign investment in and loans to India, and India’s foreign investment and loans to others). The countries in which India invests its own foreign exchange reserves have reduced their interest rates to rock-bottom levels, so India’s returns from its foreign assets have fallen further from their already abysmal levels. The rate of earnings on India’s seemingly massive foreign exchange reserves plummeted from 5.1 per cent in 2007-08 to 1.5 per cent in 2011-2012; that is, from RS 51,883 crore in 2007-08 to Rs 19,810 crore in 2011-12.[8] The foreign exchange reserves have been built up from inflows of foreign debt and investment, on which India pays high returns; whereas the reserves have to be invested abroad in secure assets such as US government debt, on which India earns very low returns. One study calculated that the net annual drain on account of foreign investment and debt by end-2007, as a percentage of India’s annual national income, was comparable to the percentage drained annually from India under the British Raj.[9] Moreover, India’s foreign liabilities are growing fast. As a result, the negative net balance of investment income too is growing fast. From -$5.5 billion in 2009-10, it has shot up to an estimated -$24 billion for 2012-13 and a projected -$28 billion in 2013-14.[10] In other words, the capital inflows are themselves one of the causes of the widening of the current account deficit, because they are leading to major outflows of investment income. Further, the drain of foreign exchange as a result of FDI is not limited to the payment of dividend, royalty, technical fees, and so on; a larger sum is expended on imports of goods by the foreign firms (which would be reflected in the merchandise trade account). For example, the net drain of foreign exchange as a result of the operations of 745 FDI companies studied by the Reserve Bank rose from $6 billion in 2008-09 to $9.7 billion in 2010-11.[11] Unfortunately, the study does not provide data whereby we can determine how much foreign investment actually came in via these 745 foreign firms. V. Foreign exchange reserves – defence against foreign exchange crisis? Despite all these alarming indicators on the external front, we are told not to worry: We are told that, unlike in 1990, when India’s foreign exchange reserves fell at one point to $1 billion and the country’s gold reserves too had to be shipped out secretly, today we have a vast sum in the kitty. As of March 15, 2013, the foreign exchange reserves stood at $292.3 billion. Earlier, the adequacy of foreign exchange reserves would be judged in terms of how many months’ imports they could pay for. The traditional norm was the ability to pay for three to four months’ imports. At one point in 1990, India’s reserves could cover scarcely two weeks’ of imports, and officials desperately tried to raise a few billion dollars from all sorts of sources. By contrast, in September 2012, when the reserves were $294.8 billion, they were estimated to cover 7.2 months’ imports. By another measure, the reserves could pay for 6.8 months’ imports and debt-servicing payments.[12] It has been recognised by numerous official committees that these measures are no longer meaningful, if they ever were. After all, the strength of a defence must be judged by the forces against which it must defend. Apart from paying for imports and debt-servicing, the reserves may be called upon to repay capital liabilities. Total external liabilities in September 2012 were $713.2 billion (more than twice the size of India’s reserves). While India’s external assets were larger than the foreign exchange reserves on that date, the remainder of the external assets – largely the direct investment abroad by Indian firms – obviously cannot be called on to repay the country’s external liabilities. Thus external liabilities in excess of the foreign exchange reserves were $418.4 billion. However, not all of these external liabilities are liable to be repaid on short notice, which is what is relevant in relation to the foreign exchange reserves. So let us look at the following items, which comprise what we can call the ‘short-notice’ liabilities: (i) short term debt (i.e., debt repayable within a year); (ii) portfolio investments (i.e., FII investments in the share markets and in debt instruments), which can be withdrawn at any time; and (iii) those NRI deposits which are fully repatriable at any time (Foreign Currency Non-Resident and Non-Resident External Rupee Account). (i) Short-term debt[13] in September 2012 stood at $159.6 billion. As a proportion of the foreign exchange reserves, it is 54.1 per cent. This proportion has been rising with alarming rapidity – as recently as in March 2012, it was 50.1 per cent of the reserves. (ii) Portfolio investments by FIIs in September 2012 stood at $164.6 billion. As a proportion of the reserves, they are 55.8 per cent. Two qualifications need to be mentioned here. First, this is the historical value of cumulative portfolio investments, i.e., simply the sum of all the amounts that came in at different times over the past two decades, but at the value at which they entered. The current market value of portfolio investments in equity would be much higher than these historical values. The exact value at which they would be repatriated would depend on the market price on that date.[14] Although the historical value of cumulative portfolio investments in the equity markets stood at $129.1 billion in September 2012, the market value stood at $236.2 billion at the end of March 2013, according to a recent report by Citi Research.[15] Thus as a proportion of the foreign exchange reserves in March 2013, FII investment in equity alone (i.e., excluding FII investment in debt) comes to nearly 81 per cent of the reserves in March 2013. Secondly, much of what is classified as ‘FDI’ may be hardly different from FII capital. ‘FDI’ is supposedly more stable than FII capital, since it is not merely financial investment, but is a long-term stake in Indian assets, associated with management control. However, a recent comprehensive study has found that, because of changed official definitions as well as official eagerness to project a larger figure of FDI, more than half of what is being classified as ‘FDI’ is of the nature of purely financial investment, such as by private equity firms, venture capital funds, and hedge funds.[16] While it could be argued that such investments are not as unstable than FII investments in the share market, they cannot be considered to be stable. (iii) Thirdly, the outstanding sum in Foreign Currency Non-Resident (FCNR) deposits and Non-Resident (External) Rupee Account deposits (NRERA) deposits was $54.7 billion in September 2012. The total of the above three items, even taking portfolio investments only at their historical value, comes to $378.9 billion in September 2012 – 128.5 per cent of the reserves. In other words, while the foreign exchange reserves appear impressive, they cannot withstand a serious panic flight of capital out of India. At any rate, the negative effects of the large current account deficit would be felt well before the foreign exchange reserves get exhausted. The RBI Governor has pointed out recently:
This is a remarkably direct warning, and it shows that the authorities are alive to the dangers in the present situation, regardless of the seeming security of the foreign exchange reserves. Refusal to reduce imports Despite this awareness, what is remarkable is that none of the authorities even consider the idea of restricting imports by various means, including by physical restrictions. The most glaring example is that of gold, imports of which, already very high, have soared since 2009. In 2011-12, gold imports (net of re-export) accounted for half the current account deficit of 4.2 per cent of GDP. Despite various authorities taking note of this phenomenon and raising the alarm, at no point did any of them even mention the possibility of banning that part of gold imports not required for exports. This despite the fact that (i) import of gold is pure consumption, a diversion from savings; (ii) gold is obviously not part of essential consumption, but elite consumption; (iii) gold imports have been driven by speculative investors, attracted by the long rise in gold prices. The RBI Governor himself noted recently that “The concern about the quality of CAD arises from the composition of imports. If we were importing capital goods, we can maybe countenance a higher CAD because investment in capital goods implies building production capacity for tomorrow. On the other hand, import of gold... is a deadweight burden, especially at a time when the CAD is beyond the sustainable level.”[18] As an official RBI committee notes, since 2006 gold imports have been negatively correlated with share prices.[19] It appears that during the 2003-08 share prices boom domestic speculators got accustomed to annual returns on shares in excess of 20 per cent. With the 2008 crash they increased their purchases of gold, the rising price of which gave them rich returns. Since the liberalisation of all imports, including gold imports, is a tenet of the post-1991 policies, the authorities gazed mutely as gold imports soared in the post-2008 period. At the time of the presentation of the 2013-14 Budget, we witnessed the strange spectacle of the Finance Minister appealing to the people not to buy gold, but himself failing to levy any additional duties on gold.[20] With the bursting of the bubble in gold prices, speculative purchases may decline, but the other component of domestic gold demand – middle class jewellery consumption – may pick up and keep gold imports high. Similarly, the growth of consumption of petroleum products in India is not a natural phenomenon like the weather. It is related to the overall pattern of production and consumption, which are themselves the product of economic policy, macroeconomic choices. It is glaringly obvious that the reigning economic policies encourage vast, wasteful consumption of all energy resources, including petroleum products. For example, the Government has systematically promoted the shift of transport away from railroad to road transport, and constructed vast road infrastructure to facilitate this; it promotes and subsidises the automobile industry in multiple ways, and degrades public transport; it promotes the civil aviation industry (the number of passengers has more than quadrupled in the last decade). The scope for reduction of imports is much larger than just these two categories, however. The import of electronic goods was $32.8 billion, or Rs 1.57 lakh crore, in 2011-12. Much of this can be eliminated right away, and some of it can be eliminated by systematically developing truly indigenous production (i.e., not mere assembly of imported parts). The latter involves planning. The trade deficit in manufactured goods has risen steeply in the last decade as a result of Government policy. The entire telecom ‘revolution’ in India has been based on imported equipment, down to the handsets. India is considered a major software exporter, but it has not developed any significant production base in computers. Its civil aviation industry has grown on the basis of imported aircraft.[21] We have seen earlier that, given the low and declining ratio of our current receipts to current payments, it is impossible to address the external crisis merely by scrambling to hike exports. It is necessary to suppress imports. The inability of the rulers to take any steps in this direction is not an incidental flaw or shortcoming: it has deep roots in the political economy of India, in the character of its class rule. The entire liberalisation process since 1991was meant to render India internationally competitive and overcome the balance of payments difficulties which had plagued it in one form or another since the mid-1950s. It has instead deepened India’s dependence on foreign capital, increased foreign ownership of Indian assets, and strengthened foreign dictation of Indian economic policy. The part played by the IMF and World Bank in 1991 has now been taken over by credit rating agencies, whose employees extensively monitor Indian policy-making and spell out the demands of foreign capital. To take just the latest example: a news report of April 12 informs us:
What could be more pathetic, indeed, than Montek Singh Ahluwalia, the deputy chairman of the Planning Commission of ‘sovereign’ India, supplicating tuppenny inspectors of international rating agencies in the following fashion?
Notes: [1] Kirit Parikh, who recently chaired an official committee which recommended an increase in energy prices. http://epaper.timesofindia.com/Default/Scripting/ArticleWin.asp?From=Archive&Source=Page&Skin=TOINEW&BaseHref=CAP/2010/02/08&PageLabel=16&EntityId=Ar01600&ViewMode=HTML&GZ=T (back) [2] 2012-13 data for imports, trade deficit and current account deficit are projections by the Prime Minister’s Economic Advisory Council. The source of the remaining data is the Reserve Bank of India. (back) [3] This was also due in part to the slowdown in industrial growth, which led to a slowdown in imports, and hence the trade deficit. Nevertheless, it is important to note that invisibles receipts nearly tripled, from $9.8 billion in 2000-01 to $27.8 billion in 2003-04. (back) [4] The average growth rate of current payments (in dollars) during 2004-05 to 2011-12. (back) [5] The average growth rate of current receipts (in dollars) during 2004-05 to 2011-12. (back) [6] C. Rangarajan, “Why the India story is intact”, Hindu Business Line, 4/5/13. (back) [7] S.K. Verghese, Wilson Varghese, “India’s Mounting External Debt and Servicing Burden”, Economic and Political Weekly, 26/11/88. (back) [8] Reserve Bank of India, Annual Report, 2007-08 and 2011-12. (back) [9] See N.K. Chandra, “India’s Foreign Exchange Reserves: A Shield of Comfort or an Albatross?”, EPW, 5/4/08. (back) [10] Prime Minister’s Economic Advisory Council, Review of the Economy 2012-13. (back) [11] That is, Rs 27,820 crore in 2008-09, and Rs 44,363 crore in 2010-11. “Finances of Foreign Direct Investment Companies: 2010-11”, RBI Bulletin, December 2012. (back) [12] RBI, “Half-Yearly Report on the Foreign Exchange Reserves”, September 2012. (back) [13] Here we are referring to short-term debt by ‘residual maturity’, i.e., including not only debt that was originally contracted as short-term debt, but also that portion of long-term debt which falls due within a year from the date. (back) [14] N.K. Chandra, op cit. (back) [15] “Foreign investors increase stake in India Inc.”, Times of India, 10/5/13. (back) [16] K.S. Chalapati Rao, Biswajit Dhar, “India’s FDI Inflows: Trends and Concepts”, ISID Working Paper, 2011. Also see N.K. Chandra, op. cit .(back) [17] D. Subbarao, “India’s Macroeconomic Challenges: Some Reserve Bank Perspectives”, RBI Bulletin, April 2013. (back) [18] Subbarao, op. cit. (back) [19] RBI, Report of the Working Group to Study the Issues Relted to Gold Imports and Gold Loans NBFCs in India, February 2013. (back) [20] The argument the Government and pro-liberalisation economists trot out against restricting gold imports either physically or through higher duties is that such measures will revive smuggling of gold. However, this argument does not hold. First, whether or not the State machinery is able to check gold imports depends primarily on the availability of political will to do so. Secondly, even if smuggling does revive, the total amount of gold imports (including smuggled gold) would fall quite sharply, compared to the present situation of free availability. Thirdly, whether gold is smuggled or brought in legally makes no difference to the two negative impacts of gold imports, namely, diversion of potential savings to luxury consumption, and drain of foreign exchange. Hence whichever option results in a reduction in total imports should be chosen, in this case, physical restriction. (back) [21] Sudip Chaudhuri, “Manufacturing Trade Deficit and Industrial Policy in India”, EPW, 23/2/13. (back) [22] “FinMin to pitch for ratings upgrade with Fitch, other agencies”, Business Standard, 12/4/13. (back) [23] Interview, “We are serious about fiscal consolidation,” Mint, 17/9/12. (back)
|
||||
|
| Home| About Us | Current Issue | Back Issues | Contact Us | |
|||||
|
All material © copyright 2015 by Research Unit for Political Economy |
|||||