No. 64, December 2016
|
|
|
|
No. 64, December 2016 |
|
|
No. 64
|
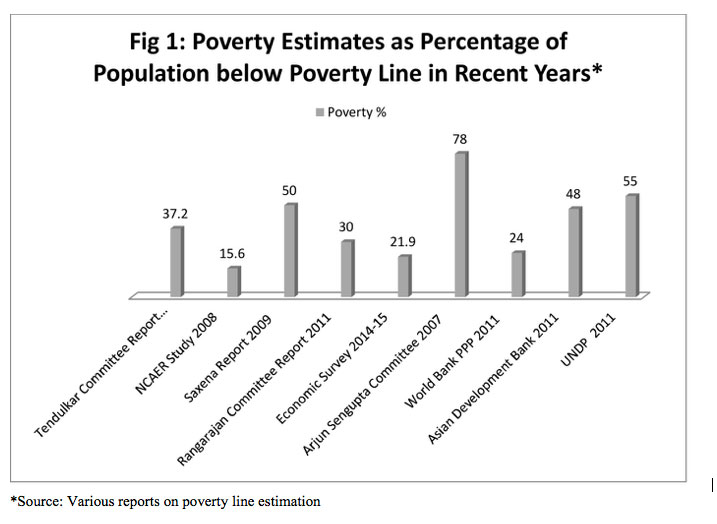
Why the Poor Do Not Count -- Manali Chakrabarti (manalichakrabarti[at]yahoo.com) According to the World Bank, India’s nominal GDP crossed the $ 2 trillion mark in 20141, and is slated to grow at close to 8 per cent annually in 2016 and 20172. To put this in perspective: In 1991, the year the Indian economy was opened up and we embraced neoliberal policies, the Indian GDP was about $275 billion, which by the turn of the century had doubled to $481 billion. But the really rapid growth of the Indian economy has been in the last 15 years, which saw GDP increase by almost four-and-a-half times. One needs to remember that these include years which saw the greatest global recession since the 1930s. Thus, for the economy as a whole the promised ‘achche din’ seem to be happening and there are numbers to prove it. The policymakers who have been rooting for further opening up and freeing of the economy have been justifiably sporting a smug expression with this quantitative endorsement of their position. However, one vexing question for them is that some people continue to claim that all this growth has not translated into alleviation of poverty–the ‘poor’ have been stubbornly impervious to this stunning growth of the economy. And this is disturbing, particularly given that the officials have not even been able to decide how many poor people exist and, more importantly, how to identify them. The ‘Poverty Line’ and a Brief History of Poverty Level Calculation As is evident from Figure 1 the poverty line seems to be a rather subjective concept with anywhere from around 12 per cent to almost 80 per cent of the population estimated to be under it. The NCAER study (2008) claims 15.6 per cent people to be poor, the Rangarajan Committee 2014 records every third Indian to be poor, while the Economic Survey 2014-15 claims every fifth Indian to be poor. The Saxena Report (2009) instituted by Ministry of Rural Development assesses every second Indian to be poor while the Arjun Sengupta Committee Report sensationally claims that four out of five Indians are poor or vulnerable! Let us delve briefly into the history of poverty measurement in India to make sense of this elusive poverty line. Monthly Per Capita Consumer Expense (MPCE) poverty line The Planning Commission had been seeking to measure the number of poor in the country since the 1960s and in the early 1970s a group of experts decided that the appropriate line should be set according to a minimum consumption basket, including average monthly food consumption of 2,400 calories of food per capita per day in rural India and 2,100 calories per capita per day in urban India.3
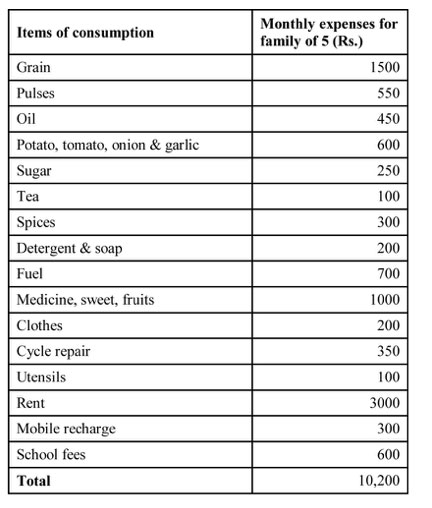
But subsequently, the poverty line has simply been updated annually by adjusting for the inflation determined by the consumer price indices without updating the basket of commodities to those actually consumed in subsequent years. And over the years, the numbers ceased to reflect the actual food (calories) consumption. This is because not only has the pattern of food consumption changed drastically over the decades, the cost of other components of the basket have risen disproportionately higher4, resulting in a situation where even the cost of minimum food required is not covered by the ‘official’ poverty line. That is, instead of being anchored in a particular level of calorie consumption, as originally was the case, the poverty line is anchored in an outdated basket of commodities. As a result, irrespective of whether it is correct or wrong to anchor the poverty line in a particular level of calorie consumption, the new lines are not comparable to the earlier poverty line and cannot be used to show a reduction in poverty, as the Government and various scholars are making out. And yet the use of that line has been defended by the Government and policymakers by simply assuming that the families have chosen to buy other items rather than the minimum required nutrition. These poverty lines also drew a lot of flak for focussing exclusively on food consumption norms, and ignoring expenditure on health, education and other basic needs. Tendulkar Committee Report 2009 Rangarajan Committee’s Poverty Estimates 2014 Other Estimates Of Poverty: Saxena Committee, NCEUS Report and World Bank Report The National Commission for Enterprises in the Unorganised Sector (NCEUS) was established in 2004 under Prof Arjun Sengupta, to examine ways to provide the welfare of the country’s unorganised workforce. More than 90 per cent of the workforce and about 50 per cent of the national product are accounted for by the informal economy. Most of them work as low paid agricultural workers, or in small manufacturing units and shops and as hawkers or delivery men and have no social security and little or no job security. In its study, NCEUS set an overall minimum of Rs 20 per day per person in 2004-05 as its cut-off for defining the “poor and vulnerable”, and calculated that 77 percent of Indians fell below this cut-off. The World Bank's poverty cutoff of $1.25 realigned by PPP estimate pegs Indian poverty at around 26% in 2011. A recent World Bank research note titled Ending Extreme Poverty and Sharing Prosperity: Progress and Policies (October, 2015) seems to have already achieved its stated goal on paper by simply employing a modified methodology. The more ‘accurate’ measurement method has pegged India’s poverty rate at 12.4 percent in 2011-12. Further this dramatically low estimate‘will set the baseline for future India and global poverty estimates’.9 This ingenious solution would in fact miraculously bring down the global poverty rate too, as India constitutes over 1/6th of the world population!And then that still leaves the UNDP report and several other national and international attempts to estimate poverty. See Boxes Inconvenient Reality – Just Move the Line and This Is Not a ‘Poor Family’. (The main text continues after the boxes.)
Why Is There So Much Noise Regarding the Poverty Line?
India’s economic growth reached dizzying heights, averaging 9 per cent for the period between 2003 and 2007. It then slowed when the global economy came crashing down in 2008.15 There seemed to be nothing to mar the party except for a vexing question asked in some quarters – do the advantages of this ‘miraculous’ economic growth reach all sections of society, especially the ‘poor’? The official poverty estimates published by the Planning Commission conveniently showed a decline in absolute poverty levels from 36 per cent in 1993-94 to 26 per cent in 1999-2000 and the recent Economic Survey claims that only a fifth of the population are poor. And yet the visual evidence of widespread poverty, distress and squalor remains an irksome negation of the official claims of ‘India Shining’. And not only visual evidence but statistical evidence indicates that the magnificent growth of the Indian economy has not trickled down to the poorest, if anything it seems to have gushed up even more wealth to the elite. Even as measures of income have shown a rise, some other measures of well-being have stagnated or deteriorated. Let us briefly see the effect of neoliberal policies on various sections of the population. The Majority:
The status of urban industrial worker is worse than ever before.
The agrarian sector has been in a state of crisis for decades now.
The tribal and Dalit population have been the worst hit because of ‘development’.
The dots above do not add up to a vibrant shining India aspiring to be a superpower. Instead, in many parameters, the country seems to be worse than the poorest regions of the world. So how does one reconcile a $2.1 trillion economy with very high growth rates with this picture? We cannot unless we consider the other section of this country – the elite. Let us see how the elite have fared in the last two decades. The Elite
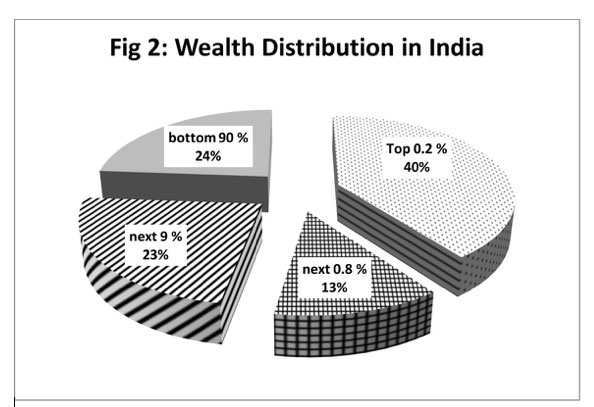
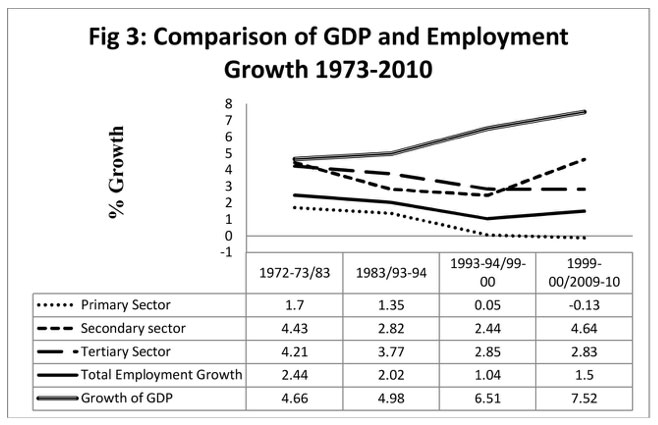
Why Are the Poor Poor? When I give food to the poor, they call me a saint. When I ask why the poor have no food, they call me a communist.― Hélder Câmara, Dom Helder Camara: Essential Writings As is evident from the above data, India is not truly one nation. In fact there are two extremely diverse nations in one geographical confinement – one of the rich (about 5 per cent, which in our country translates to over 6 crore people) and the other (95 per cent) of the poor and the abjectly poor. This explains the apparent contradictions of various parameters of the economy. And we would like to argue further that the disparities in the economic access of these ‘two’ Indias are not unrelated; in fact they are mutually responsible for the status of each other. The whole exercise of counting the poor is, in fact, an eyewash to hide the real issue of extreme inequality which has been increasing exponentially since the economic reforms.44Poverty is not a condition afflicting the poor; it is not a quantitative measure of how to provide subsistence existence to the poor which, if perfected, would lead to gradual alleviation of the poor. It is not even merely a question of economic deprivation; it is actually a political issue. The poor have no say in the political dispensation of the economy, which is evident by the various policies affecting them. Jobless Growth
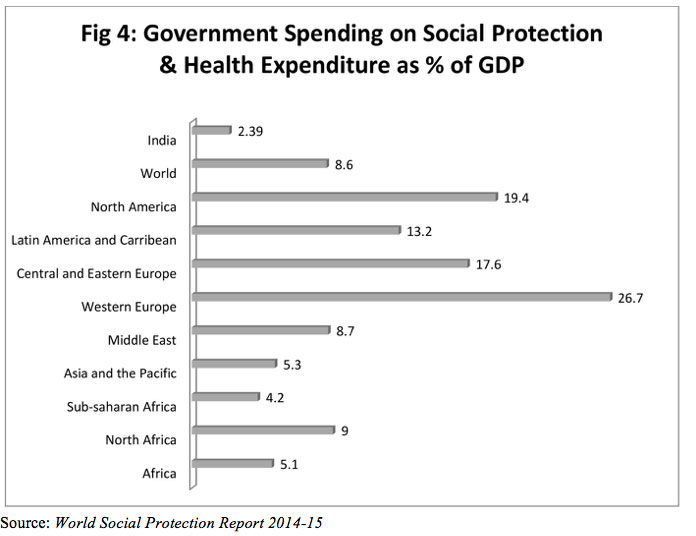
Let us briefly look at some of the recent policies, laws and budget allocations to further substantiate our point. Government Spending on Social Protection and Health
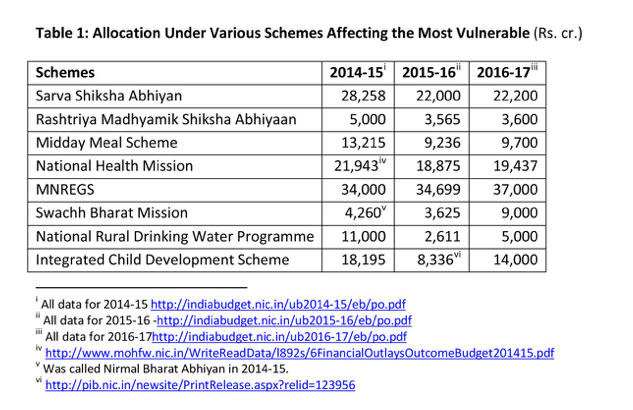
The Finance Minister claimed that social sector was one of the key areas of this year’s budget, in fact he starts off with a noble quote by Vivekanada to substantiate his point “No amount of politics would be of any avail until the masses in India are once more well educated, well fed, and well cared for”.46 But even a cursory glance at the major heads of the recent budget 2016-2017 shows that whatever be the rhetoric of the present regime ‘aam aadmi’ is not their priority and they are definitely not trying to usher in ‘achche din’ for all. Anyway, of the Rs 20 lakh crore budget, a fourth is accounted for by interest payments and another fifth by ‘security’ – i.e., the military and police. Thus the finance minister’s efforts to meet up the expectations of the various sections of the population had to be a jugglery of allocations restricted to barely 55 per cent of the budget. Decline in Budget Allocation for all Sectors and Schemes Affecting the Poor
Finance Minister Arun Jaitley claimed in his Budget speech that “After universalisation of primary education throughout the country, we want to take the next big step forward by focusing on the quality of education.” And yet in spite of such lofty sentiments the honorable Finance Minister had in fact massively reduced the budget allocation to school-related schemes in the last budget: For Sarva Shiksha Abhiyan (by 21 per cent), Rashtriya Madhyamik Shiksha Abhiyan (30 per cent) and Mid-Day Meal Scheme (by 31 per cent). This year these schemes have been offered a token increase which is nowhere close to what was allocated in 2014-15. In the case of health, the flagship scheme National Health Mission (NHM) allocation has also declined over the years both in real terms as well as nominal terms as is evident from the table above. The overall budget allocation for Department of Health and Family Welfare has been reduced from Rs35,16347 crore in 2014-15 to Rs 29,65348 crore in 2015-16 and in this budget it has been marginally increased to Rs 31,300 crore.49 Swachh Bharat is an umbrella programme which covers the National Rural Drinking Water Mission (NRDWM) and Swachh Bharat Abhiyan (SBA). The budget allocation for NRDWM in 2014-15 was Rs 11,000 crore and Rs 4,260 crore for Nirmal Bharat Abhiyan (which later was transformed to SBA), a combined budget of Rs 15,260 crores. In 2015 the Prime Minister started the Swachh Bharat Abhiyan and the budget for Swacch Bharat including NRDWM and Swacch Bharat Abhiyan was slashed by Rs 9,000 crore! The message probably was that if one does not drink water one would not need to use the toilet either – an ingenious way to handle two problems drinking water and access to sanitation. This year the total allocation is 14,000 crore but two third of it is towards Swachh Bharat Abhiyan and only Rs 5000 crore is for drinking water! About 2.3 crore children in India are malnourished, and still the scheme that deals with malnourishment–the Integrated Child Development Scheme (ICDS) – has seen a decline of over 55 per cent in allocation in the 2015-16 budget. This year it has been raised to Rs 14,000 crore and yet it is even nominally 25 per cent less than the allocation in 2014-15, as seen in Table 1. Overall there was a 55 per cent reduction in the budget for the Ministry of Women and Child Development from Rs 21,100 crore in 2014-15 to Rs 10,286 crore in 2015-16.50,51 And in keeping with the pattern the present allocation of Rs 17,300 crore is 20 percent less (nominally) than the budget allocation two years ago. An oft repeated argument to justify these cuts in allocation is the devolution of tax revenues to the states. But if allocations are slashed simultaneously with devolving of revenues it would merely shift the responsibility of social sector spending to the states and in effect defeat the supposed benefits of devolution. This changed Centre-State financial relation has in fact adversely affected states with large poor population (the BIMARU states) requiring significant social spending. The long term effect of this arrangement would be evident only in a while but even a cursory assessment reveals that the poor maybe worse off than before: For example, Bihar’s share in central tax pool has increased by 21 per cent, but the central grants that the state received dipped by 42 per cent. As a result, there is a net loss of around Rs 4,000 crore in the state’s budget. For Rajasthan, the share in tax pool went up by 27 per cent while it saw a dip of 28 per cent in Central grant-in-aid.52Even more alarming is that the Government seems to be dismantling offices which gather information on the poor and the marginalised. The Union Health Ministry has shut down the National Nutrition Monitoring Bureau (NNMB) which generated data on the nutritional status of socially vulnerable groups. The Bureau, under the Indian Council of Medical Research (ICMR), had been critical in informing the government’s poverty alleviation interventions with periodic assessments of nutrient deficiency among tribal communities, pregnant women, adolescents and “at-risk” elderly population in India.53 But unfortunately for the rulers “absence of evidence is not always evidence of absence”, especially for a phenomenon ubiquitously evident in our country. Budget allocation to agriculture consistently inadequate See Box How to Feed a Billion for an argument for universal Public Distribution System.
A continuing theme of the present Government is that in spite of being committed to the objective of ‘Wiping every tear from every eye’ the efforts are thwarted because of leakages56 of subsidies. It claims to have made an ‘accurate quantification’ of various heads which do not reach the poor.57 And yet the policymakers find adequate resources to subsidise the wealthiest of this country – individuals and corporations. Subsidies to the Super Rich The revenue foregone by the central government for the financial year 2015-16 is a whopping Rs 6,11,128.31 crore, a figure higher than the fiscal deficit of Rs 5.20 lakh crore projected for this financial year.58,59 As Sainath sums it up, ‘But budgets only started carrying that annexure (revenues foregone) a few years ago, and we only have the data from 2005-06 to 2013-14. In those nine years, the corporate karzamaafi amounted to Rs 36.5 lakh-crore…For those stricken by number-crunchitis: that works out, on average, to Rs 1,110 crore every day—for nine years. That’s one hell of a free lunch."60 If we add up the figures for 2014-15 and 2015-16, it amounts to around Rs 49 lakh crore or Rs 1,237 crore per day for 11 years. To add to this, the Union Budget 2015-2016 has proposed cutting basic rate of corporate tax to 25 per cent from current 30 per cent over the next four years,61 making corporate tax lower than personal tax. At present the effective tax rate is only 23 per cent, as against a statutory rate of 32-33 per cent. Further, due to distortions in taxation system, the benefits that accrued to large companies with higher profits are substantially higher than those to smaller units.62Jan Dhan Yojana and the Non Performing Assets At the other end of the spectrum,over 433 borrowers had outstanding loans of more than Rs 1,000 crore each, amounting to Rs 16.31 lakh crore. The top ten defaulters on loans from public sector banks account for Rs 28,000 crore.67 The media these days is agog with the case of liquor baron Vijay Mallya, who is facing legal charges for willful default by his group to the tune of Rs 9,000 crore. Of this, Rs 7,000 crore is owed by the defunct Kingfisher Airlines. Not surprisingly, this money is owed to public sector banks, and they have collectively been able to recover a mere Rs 6 crore. To add insult to injury, Mallya was hoping to whisk away a severance package of Rs 515 crore from Diageo, which has bought over the group’s flagship company UB Spirits. But this is just one fish in a barrelful of rotten fishes. In fact the total Non Performing Assets of PSU banks have risen five-fold in four years, from Rs 71,000 crore in 2011 to 3.6 lakh crore in 2015.68 And this is after periodical ‘cleaning up’ of financial statements of banks – between 2013-2015, twenty-nine public sector banks wrote off as much as Rs 1.14 lakh crore of bad debts.69 The perilous exposure of public sector banks indicates the complete unaccountability of the State to the public. As Mallya has rightly pointed out, even the State Bank of India was also culpable, as the bank knew of his company’s financial position and still lent to it. Other major policies which would further disenfranchise the poor and are being pushed by the present regime include: Dilution of Labour Laws In October 2014, the Prime Minister unveiled a programme titled‘Shrameva Jayate’, to support his ‘Make in India Campaign’. As part of this programme, the Ministry of Labour and Employment has developed a unified web portal 'Shram Suvidha', which offers a single online common return facility for firms under 8 of the 10 Central Labour Laws/rules.70 It also does away with the system of labour inspection; instead the employers are required to submit a self-certification of compliance online! The Labour Ministry proposes to ‘simplify and rationalise’ labour laws by doing away with 44 existing central labour laws and instead implement 4 codes of labour.71 Experts claim that safeguards of workers’ rights, already very poor, are going to be eroded further by this restructuring.72 The new regulations would render superfluous the role of the existing enforcement authorities such as the Employees’ Provident Fund Organisation (EPFO), the Employees’ State Insurance Corporation (ESIC), the Labour Welfare Department and even the Chief Labour Commissioner. Further, the Small Factories (Regulation of Employment and Conditions of Services), exempting units employing up to forty workers from at least fourteen basic laws, including the Factories Act, the Industrial Disputes Act, the ESI Act and the Maternity Benefits Act, was also slated to be put before the Cabinet for vetting.73 In fact the Ministry of Labour and Employment had announced that it wants to table and get passed nine bills in the winter session of Parliament last year.74 But amid opposition by all trade unions the Government has shelved its ‘ambitious’ labour reform bill for the time being.75 Instead, it has taken the route of getting BJP-led state governments to carry out changes at the state level. Land Acquisition Ordinance 2015 With a stroke of pen, rather than a parliamentary process, the present Government has compromised the safeguard provided for millions of affected people. Briefly the ordinance: * Exempts special categories of projects from social impact assessment and obtaining consent from affected families. * Dilutes the requirement of utilization of land within five years of acquisition, else to be returned to the owner.78* Distinction between fertile/unfertile and irrigated/non-irrigated land has been done away with for acquisitions which would have serious impact on agricultural labourers and share croppers.79 In August 2015 the ordinance was allowed to lapse by the government due to continued opposition by various constituencies and political parties. It was also viewed as a tactical retreat in face of Bihar elections.80 And yet the Government seems to be committed to implementing the provisions of the LARR Ordinance 2015 in a piecemeal fashion – state by state. In fact it seems to have already been revived by the government of Gujarat by passing the Right to Fair Compensation and Transparency in Land Acquisition, Rehabilitation and Resettlement (Gujarat Amendment) Bill, 2016 in its state assembly. According to activists on the ground the tenor of the Gujarat Bill is almost identical to the LARR ordinance, 2015.81 Dilution of Forest Rights Act Predictably, the government has also brought key changes diminishing the applicability of Forest Rights Act (FRA) for seeking statutory forest clearance for projects. The Environment Ministry has exempted plantations, notified as forests after December 1930,82 and not having tribal population as per 2001 and 2011 census, from the requirement of obtaining environmental clearance. It would mean that the FRA provisions would not apply to a large chunk of forest areas such as the one which the Odisha government has acquired for India’s biggest foreign direct investment project — the Posco Steel Plant in Jagatsinghpur, despite sustained resistance from locals.83 The Government has carried out numerous other dilutions of environmental and forest laws in this period.84 As is evident from the data above, the ‘economically’ poor in our country not only have to deal with abject poverty and undignified existence; they are also completely disenfranchised in the present dispensation. Their lack of political voice in the formal system denies them any possibility of meaningful alleviation of their situation. In fact, the system is geared to further accentuate the inequality. The almost unbridled power of the rich makes their sense of entitlement ‘inhuman’, reflected most aptly by the twitter reaction to Salman Khan’s conviction for killing one person in a hit and-run case:
Having no avenues in the formal system has pushed many of the most vulnerable to forces outside the system. Probably, not surprisingly, the years of the most spectacular growth in the Indian economy coincides almost entirely with ever louder and ever more militant dissenting voices from all over the country, the most significant being those of the Maoists in Central India. In a meeting of Chief Ministers in 2010, the then prime minister, Manmohan Singh, reasserted that “Naxalism remains the biggest internal security challenge facing our country” and that “it is imperative to control Left-wing extremism for the country’s growth"86 This, of course, was an assurance to big business, whose sentiments maybe summed up by the following quote from Anil Agarwal, the executive Chairman of Vedanta Resources, a global diversified metals and mining company headquartered in London:
And the Home Minister of the time, P Chidambaram, assured that: “The government was confident that the problem of Left-wing extremism would be overcome in the next three years.88 What is uncanny is that in spite of a change of government, there has been no change in policy. Apparently, the present Union Home Minister Rajnath Singh has also claimed that he can finish the Maoists in “three years” by flooding Chhattisgarh with troops.89 And history continues to repeat itself – just ahead of the Prime Minister’s visit to Chhattisgarh in May 2015, to sign two significant MoUs worth Rs 25,000 crore, there were reports of re-launching of the notorious State sponsored militia, the Salwa Judum.90,91 On 9 May 2015, business papers assured us that “in a big push for infrastructure development in Chhattisgarh, MoUs worth Rs 24,000 crore were signed at Dantewada in the presence of Prime Minister Narendra Modi."92 Governments may come and go but the actual show definitely must go on. And the ‘poor’seem to have no say in it – they only foot the bill. And should they defy the rulers, there is always the iron fist – the military apparatus of the State, to clobber them to submission. Conclusion For over two decades now, the Government, the policymakers and the media, in tandem have been raving about ‘Roaring India’,93‘Shining India’,94‘Growth Miracle of India’.95 India is apparently poised to leap into a Superpower status.96And yet, all these accounts have to grudgingly admit that in spite of the stupendous economic growth for over a quarter of a century now, majority of the Indians are miserably poor. In fact, the country seems to have been bifurcated into two different and mutually exclusive nations – one of the super rich comparable to the global elite and the other comparable to the poorest regions of the world. One third of the world’s 1.2 billion poorest people live in India, according to the latest Millennium Development Goals report by the UN.97The rulers have been trying to do away with this embarrassment by redefining the ‘poor’. But such exercises do not do away with the reality of abysmal conditions of existence for the majority of people. In this article, we have tried to argue that the persistence of poverty and extreme inequality are merely the symptom of a deeper malaise afflicting Indian society. The poor are poor and continue to be so because they have no political voice in the present system. Therefore, trying to implement targeted poverty alleviation measures is akin to attempting to cure chicken pox by addressing every individual blister. This effort, even if it were pursued honestly, would be doomed to fail. In fact, the whole exercise of defining poverty and identifying the poor to avoid ‘leakages’ obfuscates the real issue. As long as the structural political disparity exists (the disease) in Indian society, which disparity in turn is based on control of the means of production, poverty (the symptom) will also exist. Therefore, till that power equation changes the poor of the world will remain ‘without breakfast’ and all other rights essential for a dignified existence, as this young child ‘learned’ what they did not teach him at school. When I was young, I went to school, And history has taught us that the ruling classes have never willingly shared political power with the masses.
The following came in response to Manali Chakrabarti’s piece, which initially appeared in the RUPE blog, rupeindia.wordpress.com, in May 2016. I was very happy to read the piece ‘Why the Poor Do Not Count’ for its coherent presentation of data. It breeds more inequality and perverts both the GDP growth in terms of composition of output as well as the democratic process. More importantly, our so-called growth and our increasingly expensive popular representation act for democracy feed these mechanisms mentioned above in a two-way Best wishes,
Notes: 1. http://www.livemint.com/Politics/xziKtmtOxBJntZb41p2hDL/India-GDP-seen-surging-74-in-data-that-has-puzzled-economi.html (back) 2. http://indiatoday.intoday.in/story/india-to-grow-at-7-8-per-cent-in-2016-world-bank/1/564427.html (back) 3. http://sanhati.com/excerpted/805/ (back) 4. http://planningcommission.gov.in/reports/genrep/himanshu.pdf (back) 5. http://planningcommission.nic.in/reports/genrep/rep_hasim1701.pdf (back) 6. Though the Tendulkar Report does not make any reference to it, the FAO standard has been cited by several experts criticising the report. (back) 7. http://www.business-standard.com/article/economy-policy/new-poverty-measures-rangarajan-used-nutrition-spending-and-consumption-behaviour-114070700956_1.html (back) 8. http://www.prb.org/Publications/Articles/2010/indiapoverty.aspx (back) 9. http://pubdocs.worldbank.org/pubdocs/publicdoc/2015/10/109701443800596288/PRN03-Oct2015-TwinGoals.pdf (back) 10. Heller J, Catch-22, p. 136-137 (back) 11. Ibid. (back) 12. This is a typical case and corroborated by several other workers whom we checked with. (back) 13. http://en.wikipedia.org/wiki/Neoliberalism accessed on 4.05.2015 (back) 14. OECD report on India, quoted from http://en.wikipedia.org/wiki/Economic_liberalisation_in_India#cite_note-oecdindia2007-19 accessed on 4/05/2015 (back) 15. http://en.wikipedia.org/wiki/Economy_of_India#Post-liberalisation_period_.28since_1991.29 accessed on 4/05/2015 (back) 16. The HDR defines HDI as a summary measure for assessing long-term progress in three basic dimensions of human development: a long and healthy life, access to knowledge and a decent standard of living. (back) 17. Definition of IHDI in HDR 2014: The HDI is an average measure of basic human development achievements in a country. Like all averages, the HDI masks inequality in the distribution of human development across the population at the country level. The 2010 HDR introduced the Inequality-Adjusted HDI (IHDI), which takes into account inequality in all three dimensions of the HDI by ‘discounting’ each dimension’s average value according to its level of inequality. The IHDI is basically the HDI discounted for inequalities. The ‘loss’ in human development due to inequality is given by the difference between the HDI and the IHDI, and can be expressed as a percentage. As the inequality in a country increases, the loss in human development also increases. (back) 18. Multidimensional Poverty Index (MPI), has been developed by the Oxford Poverty and Human Development Initiative. It measures deprivation on six indicators in the same households in education, health and living standards among others. (back) 19. HDR 2015 (back) 20. http://www.thehindu.com/news/national/inequality-pulls-back-india-undps-human-development-report/article7988558.ece (back) 21. http://www.guardian .co.uk/world/ 2009/oct/ 04/india- slums-children- death-rate (back) 22. Infant mortality ratio (IMR) is the number of deaths of children less than one year of age per 1000 live births. The ratio for a given region is the number of children dying under one year of age, divided by the number of live births during the year, multiplied by 1,000. http://en.wikipedia.org/wiki/Infant_mortality (back) 23. Children in India 2012- Ministry of Statistics and Programme Implementation, GOI http://mospi.nic.in/mospi_new/upload/Children_in_India_2012.pdf (back) 24. http://articles.timesofindia.indiatimes.com/2009-10-05/india/28104116_1_child-deaths-newborn-deaths-neonatal-diseases (back) 25. http://articles.timesofindia.indiatimes.com/2013-08-08/india/41200919_1_acute-malnutrition-silent-emergency-world-bank-report (back) 26. http://www.hindustantimes.com/india/india-recorded-largest-number-of-tuberculosis-cases-in-2014/story-N9JZlyldn5PYEV4ZzWFfXM.html (back) 27. Annual Survey of Industries quoted from http://www.livemint.com/Opinion/53GWGOGWiVuqZibDu4hxnO/Is-Indias-labour-market-moving-towards-a-May-Day-situation.html (back) 28. India Labour & Employment Report, 2014 quoted from 58/deformed.html (back) 29. http://thewire.in/2016/02/09/how-the-indian-growth-story-is-incomplete-without-taking-stock-of-inequality-21173/ (back) 30. http://www.epw.in/journal/2016/3/notes/wages-and-non-wage-benefits-organised-manufacturing.html?0=ip_login_no_cache%3D1ab2800545b3ee151f9d6d610e639a32 (back) 31. http://www.bbc.com/news/world-asia-india-28205741 (back) 32. http://www.thehindu.com/opinion/columns/sainath/farmers-suicide-rates-soar-above-the-rest/article4725101.ece (back) 33. http://www.thehindu.com/opinion/columns/sainath/farmers-suicide-rates-soar-above-the-rest/article4725101.ece (back) 34. http://mospi.nic.in/Mospi_New/upload/nss_71st_ki_health_30june15.pdf (back) 35. Working Group on Human Rights in India and the UN (WGHR) quoted fromhttp://timesofindia.indiatimes.com/india/India-uproots-most-people-for-progress/articleshow/13792551.cms (back) 36. Ibid (back) 37. http://articles.economictimes.indiatimes.com/2014-05-15/news/49873394_1_communal-violence-report-armed-conflict (back) 38. http://www.livemint.com/Money/VL5yuBxydKzZHMetfC97HL/Richest-1-own-53-of-Indias-wealth.html (back) 39. Ibid. (back) 40. http://www.forbes.com/sites/naazneenkarmali/2014/09/24/indias-100-richest-of-2014-are-all-billionaires-for-the-first-time/ (back) 41. http://www.rediff.com/business/slide-show/slide-show-1-117-lakh-ultra-high-networth-individuals-in-india/20140724.htm (back) 42. http://newsclick.in/india/india%E2%80%99s-trickle-policy (back) 43. http://www.thehindu.com/news/india-third-on-black-money-list-report/article6696491.ece (back) 44. http://www.livemint.com/Opinion/l1gVncveq4EYEn2zuzX4FL/Nearly-half-of-Indians-survived-on-less-than-Rs38-a-day-in-2.html (back) 45. Economic Survey 2013 quoted from http://www.newindianexpress.com/columns/2014/11/25/Decoding-Jobless-Growth/article2538969.ece (back) 46. http://www.catchnews.com/budget-news/budget-2016-what-does-it-hold-for-the-social-sector-1456745275.html (back) 47. http://www.mohfw.nic.in/WriteReadData/l892s/6FinancialOutlaysOutcomeBudget201415.pdf (back) 48. http://mohfw.nic.in/WriteReadData/l892s/6541236578963214.pdf (back) 49. http://indiabudget.nic.in/ub2016-17/eb/po.pdf (back) 50. http://www.counterview.net/2015/03/union-budget-allocation-for-children.html (back) 51. http://indiabudget.nic.in/ub2015-16/eb/sbe108.pdf (back) 52. http://www.downtoearth.org.in/test/news/central-concerns-52904 (back) 53. http://www.thehindu.com/news/national/national-nutrition-monitoring-bureau-axed-antipoverty-schemes-starved/article7815511.ece (back) 54. http://thewire.in/2016/03/01/agriculture-sector-needs-more-than-just-income-security-for-farmers-23273/ (back) 55. The entire box is from the article in Tehelka http://www.tehelka.com/how-to-feed-a-billion-and-why-it-pays/ (back) 56. Obviously a leakage also implies that the benefit of the subsidy is cornered by the ‘non poor.’ (back) 57. http://indiabudget.nic.in/es2014-15/echapvol1-03.pdf (back) 58. http://articles.economictimes.indiatimes.com/2015-07-31/news/65074505_1_budget-estimates-april-june-fiscal-deficit-additional-rs (back) 59. http://www.firstpost.com/business/budget-2015-why-cut-corporate-tax-but-not-personal-tax-mr-jaitley-2128125.html (back) 60. http://www.outlookindia.com/article/how-much-can-we-forgo-to-india-inc/291424 (back) 61. http://www.livemint.com/Politics/ikph424Cm0V8pNao13uXbI/Budget-2015-Corporate-tax-reduced-from-30-to-25-for-4-yea.html (back) 62. http://www.livemint.com/Politics/F8NkMrFwEzzKQQy9AGIfdP/Jaitley-begins-phasing-out-corporate-tax-exemptions.html (back) 63. http://economictimes.indiatimes.com/news/economy/policy/pms-inclusion-dream-unrealised-growth-in-number-of-jan-dhan-yojana-bank-accounts-outpaced-delivery-of-govt-benefits-and-subsidies/articleshow/51068715.cms (back) 64. Ibid. (back) 65. http://www.thehindubusinessline.com/money-and-banking/duplication-of-accounts-under-jan-dhan-yojna-on-rise-survey/article8348514.ece (back) 66. http://economictimes.indiatimes.com/news/economy/policy/pms-inclusion-dream-unrealised-growth-in-number-of-jan-dhan-yojana-bank-accounts-outpaced-delivery-of-govt-benefits-and-subsidies/articleshow/51068715.cms (back) 67. http://articles.economictimes.indiatimes.com/2015-03-10/news/59970147_1_lakh-crore-loan-sanctioning-npas (back) 68. http://scroll.in/article/804792/four-charts-show-how-the-bad-loan-problem-of-indian-banks-is-much-bigger-than-vijay-mallya (back) 69. Ibid. (back) 70. http://articles.economictimes.indiatimes.com/2015-04-24/news/61493646_1_contract-labour-act-minimum-wages-act-labour-ministry (back) 71. http://www.ndtv.com/india-news/labour-ministry-sets-out-to-table-9-bills-in-winter-session-1238348 (back) 72. http://scroll.in/article/725006/as-one-labour-law-replaces-four-existing-laws-is-something-lost-in-the-fine-print (back) 73. http://www.frontline.in/cover-story/labour-under-attack/article6540729.ece (back) 74. http://www.thehindu.com/news/national/labour-ministry-seeks-to-table-nine-bills-in-winter-session/article7823613.ece (back) 75. http://www.hindustantimes.com/india/labour-reforms-abandoned-centre-to-push-pro-labour-laws-instead/story-kWV4HwHCpEd2ogSJrCq8uM.html (back) 76. Actually on 31st December, 2014 so that it got enforced before the dawn of the new year! (back) 77. Right to Fair Compensation and Transparency in Land Acquisition, Rehabilitation and Resettlement, 2013 (back) 78. A CAG report on SEZ tabled in November 2014 found that of the 45,635 hectares of notified land 38 per cent remain unutilized. (back) 79. Data quoted from http://www.theweekendleader.com/Opinion/3556/why-land-ordinance-of-modi-government-is-anti-people.html (back) 80. http://www.thehindu.com/news/national/land-acquisition-ordinance-bill-gets-a-burial/article7597517.ece (back) 81. https://counterview.org/2016/04/01/gujarat-government-revives-larr-ordinance-2015-all-over-again-reveals-its-true-anti-farmer-face/ (back) 82. That is areas not recorded by the British as a Forest. (back) 83. https://www.opendemocracy.net/openindia/basudev-mahapatra/modi-government%E2%80%99s-war-on-environment (back) 84. See Nitin Sethi, “PMO ordered 60 changesto green clearances, environment ministry delivered on most”, Business Standard, 20/1/2015. http://www.business-standard.com/article/economy-policy/pmo-ordered-60-changesto-green-clearances-environment-ministry-delivered-onmost-115012001495_1.html (back) 85. http://timesofindia.indiatimes.com/entertainment/hindi/music/news/Salman-Khan-hit-and-run-case-Singer-Abhijeet-Bhattacharyas-tweets-condemned-as-insensitive/articleshow/47175616.cms (back) 86. http://www.thehindu.com/news/national/naxalism-biggest-threat-to-internal-security-manmohan/article436781.ece (back) 87. For a detailed treatment of big business assessment of Maoism, please refer to Varman & Chakrabarti,‘Big Business and Indian Maoists’ Alternate Economic Survey, 2011, pp 127-144 (back) 88. http://timesofindia.indiatimes.com/india/Will-overcome-Maoist-problem-in-three-years-Chidambaram/articleshow/6233378.cms (back) 89. http://www.hindustantimes.com/analysis/nda-is-pursuing-anti-adivasi-agenda-in-the-name-of-countering-the-maoists/article1-1260599.aspx (back) 90. Salwa Judum in Chhattisgarh, which claimed to be a ‘peace’ movement, between 2005 and 2009 forcibly, evicted 3.5 lakh Adivasis from 640 village. Many Adivasis were incarcerated in ‘camps’ run by Judum members and State forces and subjected to brutal forms of torture and sexual violence. Further, when it was succeeded by the State-led Operation Green Hunt from September 2009 onward, the Judum members found new identities as SPOs (Special Police Officers) who accompanied the security forces in ‘area domination exercises’, a euphemism for State terror. The Supreme Court in 2011 held that SPOs were unconstitutional and demanded their immediate disbanding but a significant section had already morphed itself into Koya Commandos and the rest were regularised as police personnel by the state government. (back) 91. Chhavinder Karma, son of the slain Mahendra Karma, made this announcement on 5 h May 2015 http://www.countercurrents.org/cdro100515.htm (back) 92. http://economictimes.indiatimes.com/news/economy/infrastructure/big-development-push-for-chhattisgarh-mous-worth-rs-24000-cr-signed-during-pm-narendra-modis-visit/articleshow/47212562.cms (back) 93. http://daily.bhaskar.com/article/NAT-TOP-video-of-launch-of-make-in-india-in-germany-is-proud-moment-narendra-modi-4968862-NOR.html (back) 94. http://en.wikipedia.org/wiki/India_Shining (back) 95. http://www.economist.com/node/17147648 (back) 96. http://fortune.com/2015/01/25/india-the-next-superpower/ (back) 97. http://time.com/2999550/india-home-to-most-poor-people/ (back) 98. Bertolt Brecht: The Song of the Class Enemy http://321ignition.free.fr/pag/en/art/pag_002/brech_05.htm (back)
|
|||
|
| Home| About Us | Current Issue | Back Issues | Contact Us | |
||||
| All material © copyright 2017 by Research Unit for Political Economy |
||||