No. 65, January 2017
|
|
|
No. 65, January 2017 |
|
|
No. 65 I. E-commerce: An Introduction II. Regulatory Issues & E-commence in India III. Employment Practices of E-commerce
|
I. E-commerce: An Introduction By e-commerce here we mean its common usage, of trading and commerce through the means of information technologies like the internet and mobile applications, which spans various sectors and aspects of an economy. Some of the sectors that form part of e-commerce are: travel (e.g. – IRCTC, MakeMyTrip, Yatra etc.), retail (e.g. – Flipkart, Amazon, Jabong etc.), classifieds (e.g. – OLX, Naukri.com, Shaadi.com, Housing.com etc.), financial services (e.g. – net banking, online wallets like Paytmetc.), and digital downloads (e.g. – Netflix, iTunes etc.).
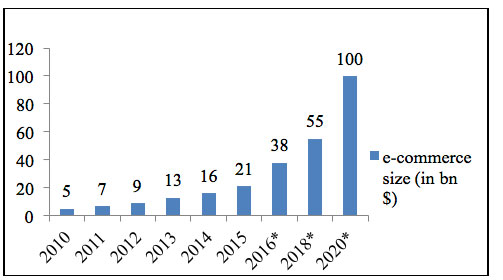
As we have said above, e-commerce has become the focus of the rising aspirations of the Indian elite, and is projected to touch the $100 billion6 mark by 2020, a 20-fold increase from $5 billion in 2010 (see Figure 1). These expectations are based on rapidly increasing internet and smartphone penetration and usage: supposedly, India has the 2ndlargest internet user base in the world, overtaking USA7 recently, even though only 22 per cent of the adult population in India have any access to internet. (The figure for the US is 89 per cent, and the global median is 67 per cent.8) According to a recent Morgan Stanley report9, the Indian e-commerce market is expected to grow the fastest globally over the next three years; in fact they ‘increased’ their 2020 estimate (of this market) from $102 billion to $119 billion. The report estimates that India will have almost 320 million online shoppers by 2020, compared with 50 million in 2015. As per the report, India received $6.6 billion in venture capital and private equity investment in 2015, a 50 per cent increase from the previous year. At $13.8 billion, the Gross Merchandise Value (GMV)10 of the top three e-commerce companies exceeded that of the top 10 offline retailers at$12.6 billion last year. Further, according to a report by the Confederation of Indian Industry and Deloitte India, the business to business (B2B) segment of e-commerce is expected to more than double from $300 billion in 2014 to $700 billion in 2020.11 India’s e-commerce market is expected to reach $220 billion in terms of GMV and reach 530 million shoppers by 2025, according to another report by Bank of America Merrill Lynch. The most fantastic aspect of the e-commerce story is the frenzy around the valuations of these companies. The only thing that they seem to be attracting more than the hype and news around them is the amount of cash and investments, at least till last year. (The Indian variants appear to be losing some of the sheen and hype in the past year, but we will come to that part of the story a little later.) ‘Valuation’ is supposed to be the current ‘worth’ of a company as determined by the present and prospective stockholders12 depending upon the price at which they are willing to sell and buy its shares.
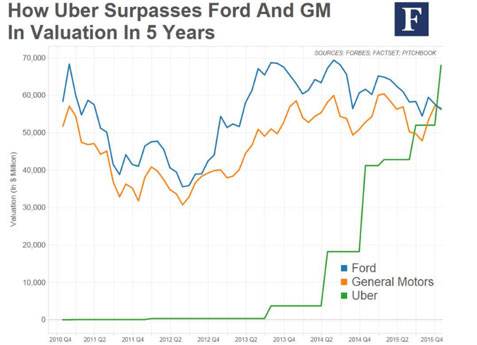
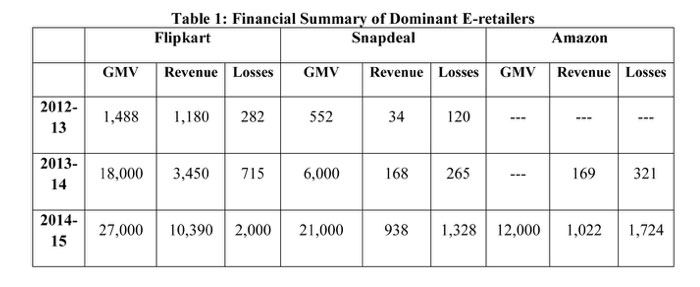
Last year Amazon as a global corporation was worth $250 billion, that is, more than Wal-Mart, which has such large number of physical stores and assets across the globe. Amazon thus became the ‘largest’ retailer in terms of the company’s worth and its founder, Jeff Bezos, became the fifth (now fourth) wealthiest individual on the planet. Similarly, last year Uber became a more ‘valued’ company than GM and Ford, having reached a valuation of close to $70 billion (see Figure 2)! While Uber, a seven-year-old ‘startup’, employs 6,700 persons, GM has more than two lakh employees at present, and is a century-old auto giant with manufacturing plants across the globe. The rapid appreciation in valuations of home-grown startups does not appear to be any different. The poster boy of e-commerce and e-retail, Flipkart, achieved a valuation of over $15 billion (Rs. 1,00,000 crores), that is, more than a corporation like Tata Motors last year, or close to Indian Oil currently, which makes it amongst the 20 topmost corporations in the country in terms of its total worth. Ola Cabs, a home-grown taxi aggregator similar to Uber, was founded only five years ago. It achieved a valuation of more than $5 billion (Rs. 33,000 crores) from the investors last year, which is almost same as the market worth of Tata Steel today! How do we make sense of such dizzying valuations of the e-commerce companies that apparently hardly own any physical assets, and are just upstarts in every sense compared to those whom they seem to have roundly beaten in terms of their worth? It is said that a company’s worth represents its current fundamentals and the potential for future earnings for its investors. Let us then attempt to examine the business fundamentals of these companies based on their past records in order to make sense of their valuations. Business Fundamentals of E-commerce Companies While the losses were across various sectors of e-commerce (real estate, online classifieds, food delivery, etc.), the biggest chunk came from e-retail, with the top three e-tailers, Flipkart, Snapdeal and Amazon, posting a massive combined loss of Rs 4,984 crores. The report also predicts that for “FY2016 losses for our sample set would be higher than FY2015”. Nor is it a one-year aberration: the combined losses of Flipkart, Snapdeal and Amazon for the year 2013-14 were close to Rs. 1,300 crores. It is very difficult to get the financial figures of these companies, as they are privately held (and, given the state of their financials, they simply refuse to comment on media queries). Yet their mounting losses are attracting some media attention. The figures and some of the financial details discussed here are based on their filings with the Registrar of Companies in India (those are incomplete as each of them has a complex corporate structure and many of the entities are registered outside India), or filings of their investors in their respective places of origin. Also, there seems to be perpetual confusion with regard to their ‘revenues’, namely, whether that is based on the GMV or the commission earned. Yet, with the help of whatever is available in the media (and the figures in the media are not often consistent), we have attempted to put a simple picture together of the financial health of the e-retail sector in Table 1. The picture, as can be anticipated, is not pretty.
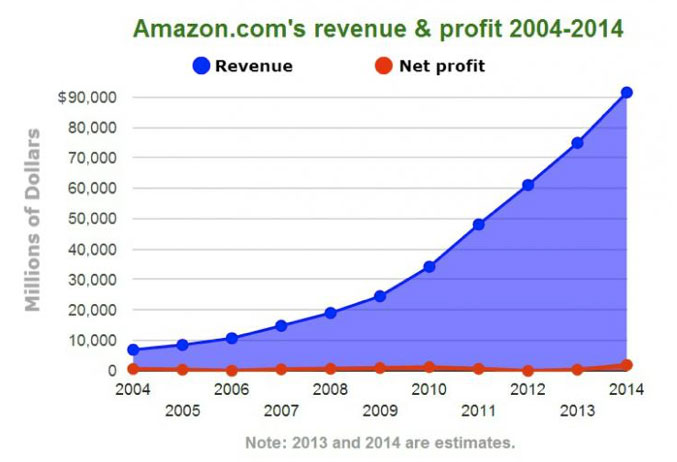
If we look closely at the table above, we find that the three e-retailers have grown at a scorching pace, and yet there is absolutely no respite from their mounting losses. While the revenues of Flipkart rose nearly nine-fold within two years from 2012-13 to 2014-15, the losses too nearly kept pace and rose seven-fold in the same period. For Snapdeal the spurt in revenues and losses in the two years is even more fantastic and stands at 27-fold and 11-fold respectively.15 For Amazon, within a year, from 2014 to 2015, the revenue increased six-fold, and the losses also rose five-fold. The two figures of growing revenues and losses are related, as per the media and some of the more informed reports, as well as those who should be in the know of these affairs. According to them these losses are primarily multiplying at such a rapid rate due to the firms’ efforts at attracting more customers and volumes. Apparently, these companies are spending massive sums for attracting customers through advertisements and sales promotion. Last year Amazon India spent Rs 662 crores in sales promotion and another Rs 744 crores on advertisements, that is, a combined expenditure of more than Rs1400 crores on marketing out of a total annual expenditure of Rs 2,750 crores.16Similarly for Snapdeal: their Rs1300 crore loss last year appears to consist almost entirely of their advertising and promotional expenses of Rs 1,060 crores. Out of this, Rs 426 crores was ‘Advertising and Publicity Expense’, while the remaining Rs 633 crores was ‘Business Promotion Expenses’.17Of all the expenses for these companies, the most interesting head is the ‘sales and promotion’ account. It is said that much of this money goes into providing discounts on whatever is sold through their platform. Apparently that is the primary cause of the cheap merchandise and various sales festivals that gather so much of hype. A whole new lexicon seems to have appeared to assess the ‘potential’ of these startups. A key factor that has emerged is something called a ‘burn rate’. During the rush of 2014-15, the higher the burn rate, the more likely the firm could attract millions and billions! ‘Burn rate’ is the rate at which an entity promises to ‘burn’ the cash, that is, spend the capital which they have sourced from the venture capitalists18 -- that too not on durable assets, but on operating expenses. The only thing that mattered was their capacity to convince financiers that the startup had the wherewithal to spend the money, according to informed sources. Thus in its peak days, in the last quarter of 2015, the burn rate for Flipkart was a mind-boggling $80 million(Rs. 500 crores) per month, or close to a $1 billion a year, as per a recent Economic Times story.19Flipkart was not an exception, as Snapdeal was said to be shelling out $25 million (about Rs 150 crore) a month20 as discounts and marketing expenses. According to a PwC report last year, at times 70-90 per cent of the funding by these companies was being spent on ‘facilitating discounts’.21 A Business Today cover story22 last year stated that a nearly $5 billion ‘war chest’ of Flipkart, Amazon and Snapdeal was going to be used primarily for cash burn, but also added that they “will probably need even more money to win market share… and that will add to their already humungous losses.”During the recent visit of the Prime Minister to the US, Jeff Bezos, the CEO of Amazon, announced that they will spend another $3 billion on India over and above the $2 billion that they have already committed. A similar report23 by the financial data portal VC Circle stated that Flipkart was losing Rs 2.23 for every Rs. 1 in net revenues, while Amazon and Snapdeal in comparison were losing almost Rs 2 each for every Rs. 1 in net revenue. Other e-commerce sectors did not seem to be faring any better with Housing.com, a real estate portal that had attracted millions of dollars in VC funding, said to have reported losses of close to Rs 280 crores on revenues of Rs 13crores for 2014-15, their advertising and promotional expenses being 123 crores!24 Zomato, the online restaurant search, discovery and delivery portal which too had a very high profile with valuation of $1 billion last year, has reported losses of close to Rs 500 crores for 2015-16.25Such massive losses are not restricted to Indian companies or even the Indian operations of foreign e-commerce companies. Let us take the case of Amazon, the mightiest of them all. Amazon began announcing quarterly profits around 2012-13 after almost 20 years of being in business (see Figure 3). The net result of nearly two decades of losses was a soaring share price. Amazon’s price-to-earnings (p/e) ratio26 in 2013 stood at an alarmingly high 550 – in comparison to technology companies like Google (p/e 29), or eBay (p/e25), or physical retail giant Wal-Mart (p/e 2). It was only in 2015 that the parent Amazon in the US has started reporting annual profits, that too profits of less than $1 billion on revenues of more than $100 billion. However, these profits are not coming from their core e-retail operations, but from the web services division that rents computing power to other organisations like Netflix and CIA.27
An analyst is quoted in a detailed analysis of Amazon29: “Amazon sells things to people at prices that seem impossible because it actually is impossible to make money that way.” On similar lines, in an analysis of the e-commerce sector, RBSA advisors30 found that for a large offline retailer like Future (the owners of the Big Bazar chain), the ratio of market capitalisation (for 2014-15) to net sales (for 2013-14) was 0.27 with net sales of close to Rs. 12,000 crores, while for Snapdeal the ratio was 107 with net sales of Rs 168 crores! Even for Flipkart the ratio was as high as 22, again signifying how far the market valuation of these companies apparently is out of sync with their actual performance. The economics of the taxi aggregators business do not appear to be any better, though prima facie they ought to be. After all, as they themselves claim, they are merely a ‘technological platform’, apparently only an ‘app’ on your mobile; they neither own a single taxi nor employ the drivers, so their expenses should be minuscule. For 2013-14, ANI Technologies, which runs Ola Cabs, reported a 50 percent jump in net loss at Rs 34.21 crore (for revenue of Rs 51 crore), against Rs 22.80 crore in 2012-13, according to filings with the Registrar of Companies.31 Ola ran up losses of Rs 796 crores for 2014-15 (that means a jump of 2200 per cent from the previous year!) according to regulatory filings, while they earned total revenue of Rs 421 crore, an eight-fold increase over the previous year.32 TaxiForSure, which was later acquired by Ola, reported a loss of Rs 17.08 crore for 2013-14 (with revenue of Rs 4.29 crore), compared with a profit of Rs 3.02 crore the previous year. Though Meru Cab reported its maiden profit for 2013-14, its accumulated loss stood at Rs 215.24 crore. The reasons again seem to be similar: the kind of expenditures involved in capturing volumes. According to an Economic Times report,33 Ola was spending over Rs 125 crore a month on operations last year. With more than $1 billion dollars in funding and operations in 100 cities, and with 2.5 lakh vehicles on its ‘platform’, Ola was apparently losing about Rs 420 per ride, while Uber, the US based taxi aggregator which is now after the Ola market in India, is losing around Rs 500 per ride.34 Apparently, Uber’s Indian arm has made ‘marginal’ profit in first two years of operation in 2014 and 2015 as per their Registrar of Companies filing.35 However, in the same report informed sources commented that “Uber must still be making losses”, but “the losses could be either parked in some other company within India or even abroad to help lower the tax burden.”Even the parent firm Uber in the US seems to be making massive losses similar to Amazon. In a recent report36 Forbes quoted ‘confidential financial documents’ to suggest that Uber, though “growing rapidly… is also burning through cash at a faster rate than ever”. Overall, Uber remained “massively unprofitable” with losses totalling$671.4 million in 2014 which expanded to $987.2 million in the first half of 2015 though cash and cash equivalents available with them increased from $1.96 billion at the end of 2014 to $4.15 billion in mid-2015. While Uber is supposed to be operating its ride-hailing services in more than 400 cities globally, it is reported to be losing more than $1 billion annually in China alone.37
Notes: 5. Some of the graphics have been borrowed from Shikhar Baid’s special studies report titled Understanding the phenomenon of frenzied growth of the Indian e-commerce companies that he submitted at IIT Kanpur in April 2016 as part of his MBA requirements. (back) 6. $1 billion is approximately Rs. 6,500 crores in today’s terms and $1 million is Rs. 6.5 crores. (back) 7. Jon Russell, “Report: India Set To Overtake U.S. To Become World’s Second Largest Internet Market”, http://techcrunch.com/2015/11/18/report-india-set-to-overtake-u-s-to-become-worlds-second-largest-internet-market/, accessed on 02/06/2016. (back) 8. “Second-largest internet market in the world, but only 22% of India uses internet”, http://www.newslaundry.com/2016/03/09/second-largest-internet-market-in-the-world-but-only-22-of-india-uses-internet/accessed on 02/06/2016. (back) 9. Richa Maheshwari, “Indian ecommerce market to grow fastest globally over 3 years: Morgan Stanley”, Economic Times, 18/2/2016, http://economictimes.indiatimes.com/industry/services/retail/indian-ecommerce-market-to-grow-fastest-globally-over-3-years-morgan-stanley/articleshow/51031652.cms, accessed on 02/06/2016. (back) 10. GMV is a term used in online retailing to indicate total salesvalue for merchandise sold through a particular marketplace over a certain time frame, and is different from the revenue earned through the commission that they get for facilitating the transaction, obviously a fraction of the GMV. (back) 11. Sayan Chakraborty, “E-commerce poised for a big leap”, Mint, 25/4/2016,http://www.livemint.com/Companies/fcTG44yxx93wH1FZLVGoSN/Ecommerce-poised-for-a-big-leap-report.html, accessed on 02/06/2016. (back) 12. Most of these stocks are not publicly traded, so the investments are made by private investors: venture capitalists, angel investors, and/ or hedge funds, etc. (back) 13. Liyan Chen, “At $68 Billion Valuation, Uber Will Be Bigger than GM, Ford, and Honda”, Forbes, 4/12/2015, http://www.forbes.com/sites/liyanchen/2015/12/04/at-68-billion-valuation-uber-will-be-bigger-than-gm-ford-and-honda/#7bb4c2e35858, accessed on 02/06/2016. (back) 14. “India's e-commerce startup losses rise to Rs 78,840,000,000!”11/2/2016, http://www.rediff.com/business/report/tech-indias-e-commerce-startup-losses-rise-to-rs-78840000000/20160211.htm, accessed on 05/06/2016. (back) 15. “Flipkart reports a loss of Rs 2,000 crore in FY15”, Mint, 3/12/2015, http://www.livemint.com/Companies/UQAIOMlml7iM6oVufedjOJ/Flipkart-reports-a-loss-of-Rs2000-crore-in-FY15.html accessed on 27/06/2016. (back) 16. “Amazon India Financials: Revenue at INR 1022Cr with a Loss of INR 1724Cr in FY 2014-15,” 27/1/2016, https://www.tofler.in/blog/indian-start-up-financials-reports-revenue-loss/amazon-india-financials-revenue-at-inr-1022cr-with-a-loss-of-inr-1724cr-in-fy-2014-15-tofler-curiosityisgood/, accessed on 06/06/2016. (back) 17. “Snapdeal reported a loss of INR 1319 cr with a revenue of INR 938 cr in FY 14-15”, 22/1/2016, https://www.tofler.in/blog/indian-start-up-financials-reports-revenue-loss/snapdeal-reported-a-loss-of-inr-1319-cr-with-a-revenue-of-inr-938-cr-in-fy-14-15-tofler-curiosityisgood/, accessed on 06/06/2016. (back) 18. Of course, investors are assured that at the end of the stipulated period the firm will become profitable. (back) 19. Aditi Shrivastava and MadhavChanchani, “Flipkart to cut expenses and earn gross profit ahead of festival season”, ET, 15/4/2016, http://articles.economictimes.indiatimes.com/2016-04-15/news/72350625_1_binny-bansal-flipkart-internet-flipkart-india, accessed on 06/06/2016. (back) 20. RBSA Advisors, “The Great E-Commerce Valuation Crash of 2018?”, May 2015, http://www.rbsa.in/home/The%20Great%20E-Com%20Crash%20of%202018_.pdf, accessed on 06/06/2016. (back) 21. Digbijay Mishra, “Deep discounts can't be long-term strategy for e-tailers: PwC”, Business Standard, 12/2/2015, http://www.business-standard.com/article/companies/deep-discounts-can-t-be-long-term-strategy-for-e-tailers-pwc-115021101030_1.html, accessed on 06/06/2016. (back) 22. Goutam Das, “The battle of the big boys: Flipkart vs Snapdeal vs Amazon”, Business Today, 24/5/2015, http://www.businesstoday.in/magazine/cover-story/ecommerce-war-flipkart-vs-snapdeal-vs-amazon-in-retail-space/story/218862.html, accessed on 06/06/2016. (back) 23.“Peek at how India's top three e-com marketplaces Flipkart, Amazon & Snapdeal fared”, 6/11/2014, http://www.vccircle.com/news/technology/2014/11/06/peek-how-indias-top-three-e-com-marketplaces-flipkart-amazon-snapdeal, accessed on 06/06/2016. (back) 24. “Housing.com Logs INR 279 Cr Loss with a Operational Revenue of Just INR 5.5 Cr [FY 14-15]”, 5/1/2016, http://trak.in/tags/business/2016/01/05/housing-com-financials-loss-revenue-fy14-15/, accessed on 06/06/2016(back) 25. Kiran Choudhury, “Zomato loss runs to Rs 1.5 lakh monthly” Business Standard, May 27 2016, http://www.business-standard.com/article/companies/zomato-loss-runs-to-rs-1-5-lakh-monthly-116052601302_1.html, accessed on 06/06/2016. (back) 26. Price to earnings is the ratio of stock price versus the earning per share of the company. It signifies the amount of investment that a potential buyer of the share is willing to make for a Rs or a dollar of earning. (back) 27. Greg Bensinger, “Cloud Unit Pushes Amazon to Record Profit”, Wall Street Journal,28/4/2016, http://www.wsj.com/articles/amazon-reports-surge-in-profit-1461874333, accessed on 06/06/2016. (back) 28. Meagan Clarkand Angelo Young, “Amazon: Nearly 20 Years in Business And It Still Doesn't Make Money, But Investors Don't Seem To Care”, International Business Times,18/12/2013, http://www.ibtimes.com/amazon-nearly-20-years-business-it-still-doesnt-make-money-investors-dont-seem-care-1513368, accessed on 06/06/2016. (back) 29. “Amazon: Nearly 20 Years in Business...” op. cit. (back) 30. “The Great E-Commerce Valuation Crash...” op. cit. (back) 31. Sounak Mitra and Digbijay Mishra, “Ola, Meru, TaxiForSure on low financial mileage”, Business Standard, 11/12/2014, http://www.business-standard.com/article/companies/ola-meru-taxiforsure-run-at-low-mileage-114121000197_1.html, accessed on 06/06/2016. (back) 32. Aditi Shrivastava and Madhav Chanchani,“Ola recorded loss of Rs 796 crore for FY15 as it spent heavily to maintain market lead”, 23/6/2016, http://economictimes.indiatimes.com/small-biz/startups/ola-recorded-loss-of-rs-796-crore-for-fy15-as-it-spent-heavily-to-maintain-market-lead/articleshow/52876645.cms, accessed on 27/06/2016. (back) 33. Aditi Shrivastava, Madhav Chanchani & Snigdha Sengupta, “Consumer Internet companies spending Rs 30-120 crore each, every month, say industry executives,”ET,10/3/2015, http://articles.economictimes.indiatimes.com/2015-03-10/news/59970389_1_matrix-partners-india-rishi-navani-idg-ventures-india, accessed on 06/06/2016. (back) 34. Vikas SN, “By reducing driver incentives, is Ola & Uber finally pushing for profitability?”, ET,30/3/2015, http://tech.economictimes.indiatimes.com/news/mobile/uber-ola-driver-incentives-profits/46745873, accessed on 07/06/2016. (back) 35.Sagar Malviya, “Uber’s India arm makes profit in first two years of operation”, 22/1/2016, http://articles.economictimes.indiatimes.com/2016-01-22/news/69989407_1_market-share-cab-hailing-ola, accessed on 07/06/2016. (back) 36. Brian Solomon, “Leaked: Uber's Financials Show Huge Growth, Even Bigger Losses”, Forbes, 12/1/2016, http://www.forbes.com/sites/briansolomon/2016/01/12/leaked-ubers-financials-show-huge-growth-even-bigger-losses/#3349cad65c99, accessed on 07/06/2016. (back) 37. Maya Kosoff, “Uber Is Hemorrhaging Money Abroad in Quest for World Domination”, Vanity Fair, 3/3/2016, http://www.vanityfair.com/news/2016/03/uber-loses-money-abroad-in-quest-for-world-domination, accessed on 07/06/2016. (back)
NEXT: II. Regulatory Issues and E-Commerce in India
|
|
| Home| About Us | Current Issue | Back Issues | Contact Us | |
|
|
All material © copyright 2017 by Research Unit for Political Economy |
|